Comparative Study
. 2006 Oct 1;498(4):525-38.
doi: 10.1002/cne.21065.

Fate of endogenous stem/progenitor cells following spinal cord injury

Affiliations
Comparative Study

Fate of endogenous stem/progenitor cells following spinal cord injury

Laura L Horky et al. J Comp Neurol. .

Abstract

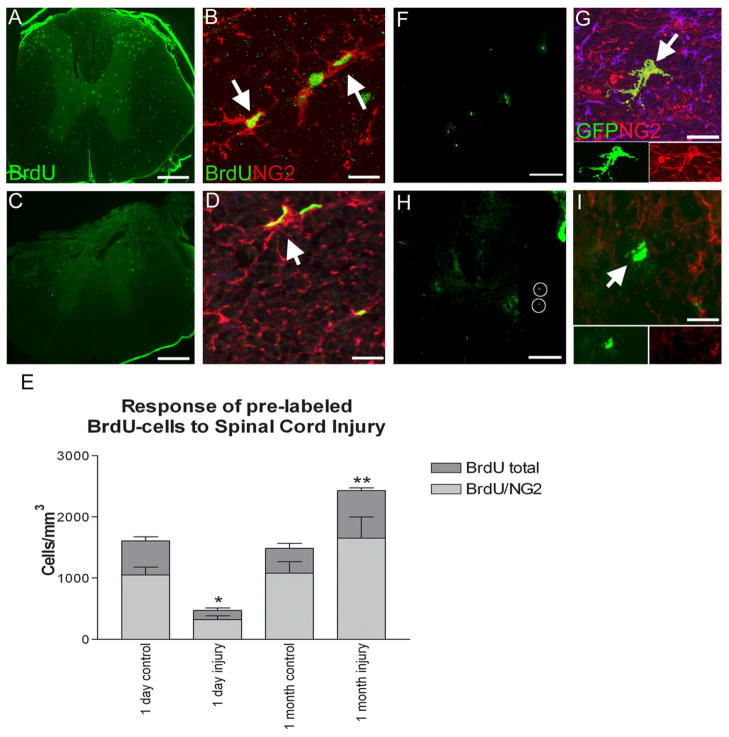
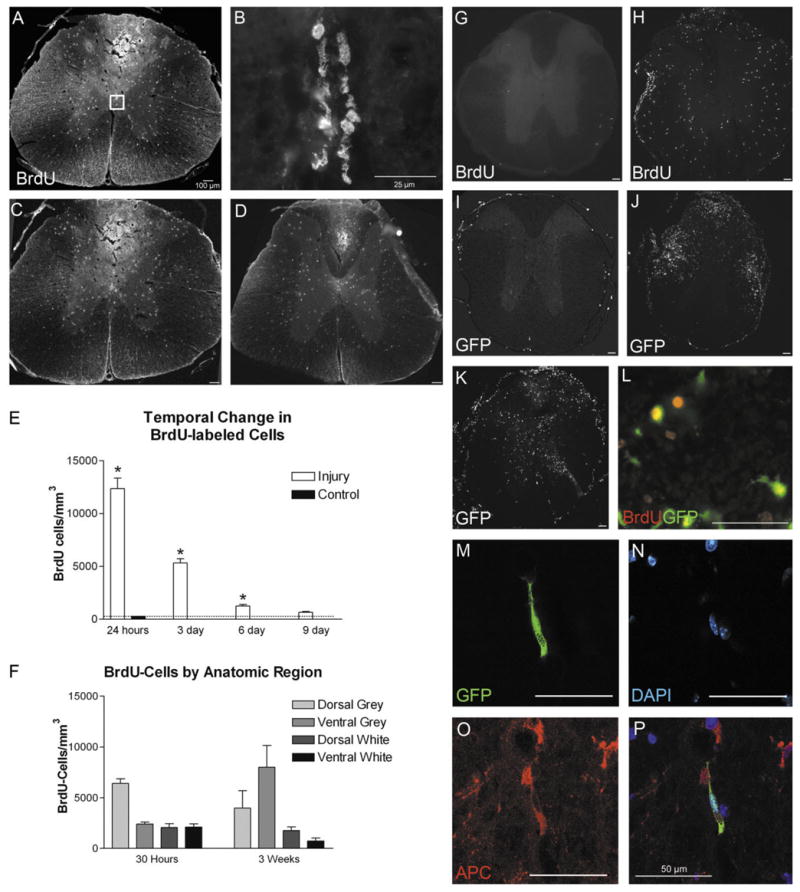
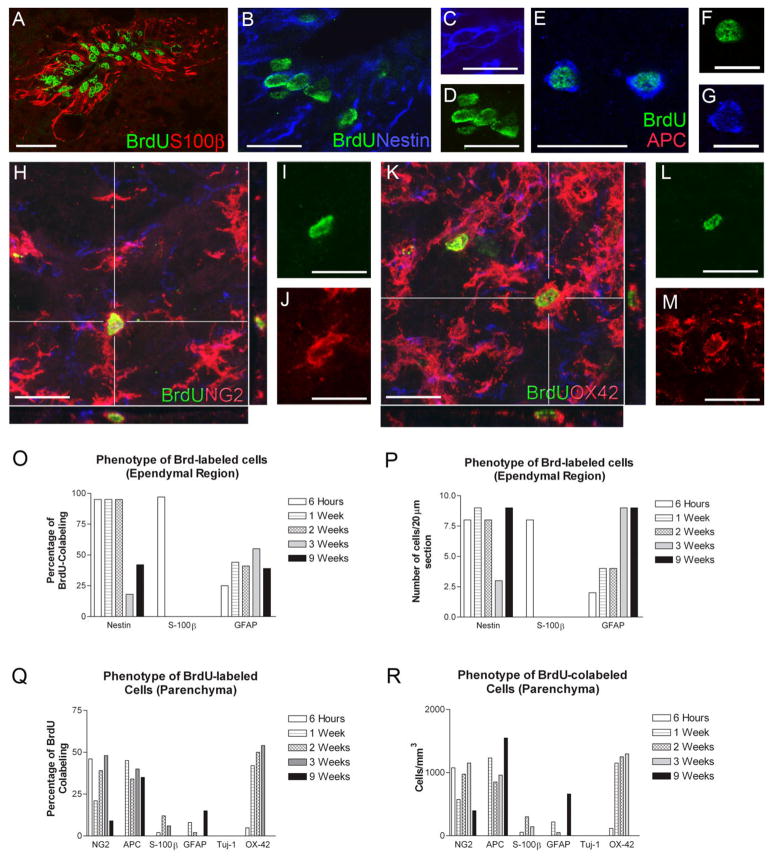
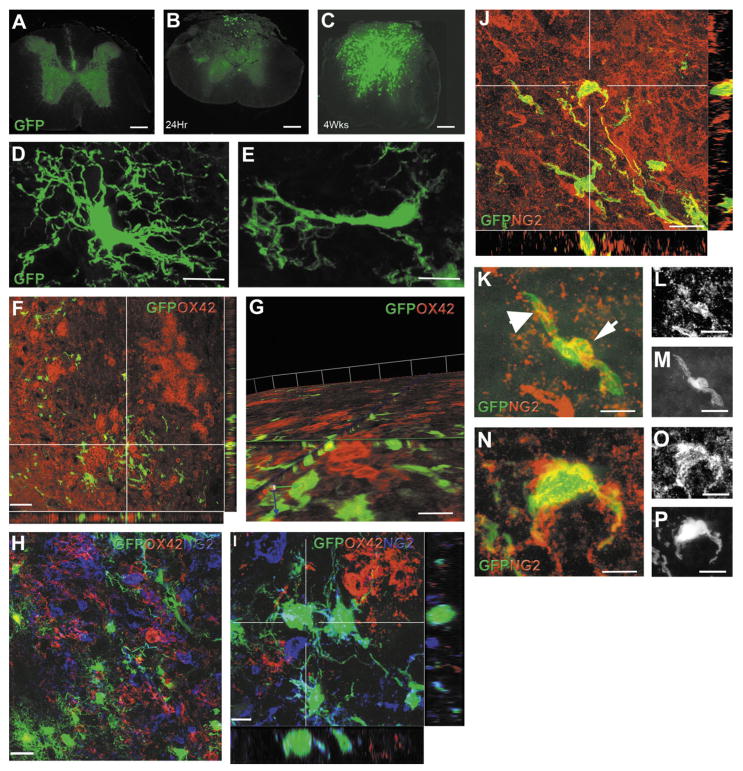
The adult mammalian spinal cord contains neural stem and/or progenitor cells that slowly multiply throughout life and differentiate exclusively into glia. The contribution of adult progenitors to repair has been highlighted in recent studies, demonstrating extensive cell proliferation and gliogenesis following central nervous system (CNS) trauma. The present experiments aimed to determine the relative roles of endogenously dividing progenitor cells versus quiescent progenitor cells in posttraumatic gliogenesis. Using the mitotic indicator bromodeoxyuridine (BrdU) and a retroviral vector, we found that, in the adult female Fisher 344 rat, endogenously dividing neural progenitors are acutely vulnerable in response to T8 dorsal hemisection spinal cord injury. We then studied the population of cells that divide postinjury in the injury epicenter by delivering BrdU or retrovirus at 24 hours after spinal cord injury. Animals were euthanized at five timepoints postinjury, ranging from 6 hours to 9 weeks after BrdU delivery. At all timepoints, we observed extensive proliferation of ependymal and periependymal cells that immunohistochemically resembled stem/progenitor cells. BrdU+ incorporation was noted to be prominent in NG2-immunoreactive progenitors that matured into oligodendrocytes, and in a transient population of microglia. Using a green fluorescence protein (GFP) hematopoietic chimeric mouse, we determined that 90% of the dividing cells in this early proliferation event originate from the spinal cord, whereas only 10% originate from the bone marrow. Our results suggest that dividing, NG2-expressing progenitor cells are vulnerable to injury, but a separate, immature population of neural stem and/or progenitor cells is activated by injury and rapidly divides to replace this vulnerable population.


Figures

Fig. 1
Fig. 1
BrdU pulse labeling of constitutively dividing cells before dorsal hemisection. BrdU was pulsed for 10 days and rat tissue was analyzed at 1 day or 1 month after BrdU. At 1 day after 10 daily BrdU-injections there were many BrdU-labeled cells (~100/section) throughout the spinal sections (A). The majority of cells expressed the proteoglycan NG2 and resembled polydendrocytes (B, arrows). A spinal hemisection was performed at T8 after the last of 10 BrdU injections and the lesion epicenter sectioned and reacted for BrdU immunocytochemistry (C). At the lesion center, very few BrdU-labeled cells were detected, indicating either significant cell loss and/or a decrease in proliferative potential dividing progenitor cells. The few BrdU-labeled cells at the lesion epicenter were often NG2-immunoreactive (D, arrow). A quantitative assessment of total BrdU at the lesion epicenter and BrdU/MG2 colabeled cells revealed a significant decline in the number of BrdU labeled cells at 1 day after injury compared to control (E, *P < 0.01 compared to 1-day control). By 1 month after injury, NG2 expression was slightly increased over injury controls indicating significant mitotic recovery (E, **P < 0.05 compared to 1 month control). To confirm that dividing progenitor cells are lost early after injury, a second mitotic label was employed. A single injection of a retroviral reporter was made at 0.5 mm lateral to midline at T8 (F). At 1 week postinjection, spinal cord sections near the injection site had an average of 5–10 virally labeled cells that expressed GFP (F). Virally labeled cells primarily colocalized with NG2 (G, inset panels show separate GFP and NG2 channels). In injured animals 1 week postvirus injection there was a significant decrease in the number of virally labeled cells indicating cell loss (H, circles indicate virally labeled cells). In addition, cell morphology indicated significant cell swelling and necrosis of virally labeled cells at the injury site (I, inset panels show separate GFP and NG2 channels). Scale bars = 200 μm in A,C; 20 μm in B,D; 150 μm in F,H; 20 μm in G,I.
Fig. 2
Fig. 2
The peak of postinjury proliferation is at 24 hours, with the majority of cells derived from parenchymal sources. Injury induced a significant increase in BrdU-labeled cells within the dorsal columns, particularly when the injection of BrdU was made at 24 hours postinjury and the tissue analyzed 6 hours later (A). BrdU-labeled cells were concentrated in the dorsal columns and neighboring gray matter at the lesion epicenter as well as 3 mm rostral (C) or 3 mm caudal (D). Significant BrdU labeling was also noted at the central canal within the lesion epicenter (C). A quantitative analysis of BrdU labeling demonstrates that peak proliferation occurs at 24 hours and BrdU incorporation is rapidly attenuated over time (E, *P < 0.01 compared to noninjured control). BrdU labeling is highest in gray matter adjacent to the lesion, with accumulation of cells at 3 weeks particularly in the dorsal and ventral gray matter. In a subset of mice, bone marrow chimeras were created to assess the contribution of the blood-derived cells to the proliferating population. BrdU labeling after bone marrow transplantation was similar in number and pattern at 24 hours (G) or 3 weeks (H) postinjection of BrdU compared to control rat tissue. In uninjured chimeric mice, the distribution of GFP-labeled cells was localized to the meningeal and vascular compartments, with limited labeling within the spinal parenchyma (I). The chimeras received dorsal hemisections at T9 and were sacrificed either 2 days or 1 month after injury. At both timepoints, the uninjured mouse cords contained ~20 – 40 GFP+ cells per section; these cells appeared to be localized within injured white matter at 2 days (J), with an increase in gray matter at 1 month (K) the meninges and along blood vessels (Fig. 3I). When BrdU was pulsed at 24 hours, 10% of the GFP-labeled bone marrow cells were colocalized with BrdU (L). The GFP-labeled cells had morphologies distinct from NG2-expression progenitor cells and many of the GFP-labeled cells had vacuoles containing neural antigens (M–P). Scale bars = 100 μm in A,C,D,G–K; 25 μm in B; 50 μm in L–P.
Fig. 3
Fig. 3
Confocal image of BrdU-labeled cells. Cells associated with the ependymal region at 6 hours after BrdU injection commonly coexpressed S100β or nestin (A–D, C and D are separate nestin and BrdU channels of the BrdU cluster on the left). At 7 days postinjury, BrdU/APC-labeled oligodendrocytes (E–G, F and G are separate BrdU and APC channels of the cell on the left) as well as BrdU/NG2-labeled cells were present (H: 20 μm confocal montage with orthogonal views taken at the center of one cell; I,J: 1 μm, single channel confocal images of BrdU and NG2 channels, respectively). A minor part of the early BrdU-labeled population was OX-42 colabeled (K, 18-μm thick confocal montage with orthogonal views taken at the center of one cell; L,M: 1-μm thick single channel confocal images of BrdU and OX42, respectively). BrdU-labeled ependyma coexpressed nestin and S100β at 6 hours after BrdU injection (O,Q). S100β expression was transient and decreased by 1 week in both ependymal and parenchymal regions (O,R). The percentage of BrdU-labeled ependyma that expressed GFAP was constant over time (O) but the total number of ependymal cells that coreacted for GFAP increased at 3 and 9 weeks (P). Within the dorsal columns at the site of injury, NG2 and BrdU colocalization was the most common cell label at 6 hours (Q,R). By 1 week, the appearance of oligodendrocytes throughout the parenchyma increased significantly, whereas the number of OX-42-positive phagocytes increased later at 2 weeks (Q,R). GFAP-labeled astrocytes were a minor population appearing outside of the ependymal region at 1 week (Q,R). The immature neuronal marker Tuj-1 was never found to colocalize with BrdU (Q,R). Scale bars = 40 μm in A–E,H–M; 20 μm in F,G.
Fig. 4
Fig. 4
Phenotype of retrovirally labeled cells 1 and 2 weeks postinjury. At 1 week following virus injection, an average of 8 –10 cells per section is labeled using this method in an intact spinal cord (A). When the spinal cord received a dorsal hemisection, numerous cells are GFP-labeled, indicating a rapid expansion at 1 week (B) and 2 weeks postinjury (C). Confocal z-stack images of GFP+ cells reveal elaborate and varied cellular morphologies 2 weeks after spinal cord injury (D,E). Note that some cells exhibited multipolar, stellate processes reminiscent of normal NG2 cells (D), whereas others exhibited larger processes and resembled reactive glia (E). NG2 colocalized with both cellular morphotypes. At 1 week postinjury the lesion site is infiltrated by a large population of macrophages/microglial cells that express OX-42 (F). Despite the robust labeling of the injury site with OX-42, GFP-labeled cells rarely colocalized with this population (Fand 3D reconstruction and rotation in G). Note the unique morphologies of the GFP-labeled cells and intimate but separate relationship with OX-42-labeled cells. Most GFP-labeled cells are NG2-immunoreactive (H) at 2 weeks and exhibit stellate morphologies (H,I, 15 μm Z-stack with orthogonal views at the point of a single cell). Some NG2-colabeled cells had the morphology of a pericyte, with no branched processes around the soma and cylindrical shaped lumen (J, 12 μm confocal stack with orthogonal views taken at the point of a single cell). GFP- and NG2-colabeled cells appear as beads on a string (K–P). Single black and white confocal images of NG2 (L,O) and GFP (M,P) illustrate a typical lumen structure. Scale bars = 200 μm in A–C; 10 μm in D,E; 20 μm in F-I; 5 μm in J; 10 μm in K–P.
Fig. 5
Fig. 5
Differentiation of virally labeled cells at 3 weeks postinjury. The predominant phenotype of virally labeled cells expressed NG2. Nonetheless, a small number of cells could also be classified as either astrocytes or oligodendrocytes. Cells with broad processes were GFAP-immunoreactive especially within the lesion epicenter (A–C, B and C are confocal stacks showing GFP and NG2 as individual channels). In rare cases, cells with oligodendrocytes morphologies and limited membrane staining were observed outside of the scar zone. In D a cell with a bifurcating process (white arrowhead) connects with at least one of two myelin tubes (green arrow heads). One of the myelin tubes appears to be sectioned at the internode (box). A 3D reconstruction of this myelin profile (E,F) shows a GFP-expressing tube colocalized with MBP (white arrowhead). Scale bars = 5 μm in A–C; 15 μm in D; 2 μm in E,F.

Similar articles

Cited by

References

    1. Adrian EK, Jr, Walker BE. Incorporation of thymidine-H3 by cells in normal and injured mouse spinal cord. J Neuropathol Exp Neurol. 1962;21:597– 609. - PubMed
    1. Alonso G. NG2 proteoglycan-expressing cells of the adult rat brain: possible involvement in the formation of glial scar astrocytes following stab wound. Glia. 2005;49:318–338. - PubMed
    1. Berry M, Hubbard P, Butt AM. Cytology and lineage of NG2-positive glia. J Neurocytol. 2002;31:457– 467. - PubMed
    1. Butt AM, Kiff J, Hubbard P, Berry M. Synantocytes: new functions for novel NG2 expressing glia. J Neurocytol. 2002;31:551–565. - PubMed
    1. Chen ZJ, Negra M, Levine A, Ughrin Y, Levine JM. Oligodendrocyte precursor cells: reactive cells that inhibit axon growth and regeneration. J Neurocytol. 2002;31:481– 495. - PubMed

Publication types