. 2006 Aug;169(2):566-83.
doi: 10.2353/ajpath.2006.051066.

Cerebral ischemia-hypoxia induces intravascular coagulation and autophagy

Affiliations

Cerebral ischemia-hypoxia induces intravascular coagulation and autophagy

Faisal Adhami et al. Am J Pathol. 2006 Aug.

Abstract

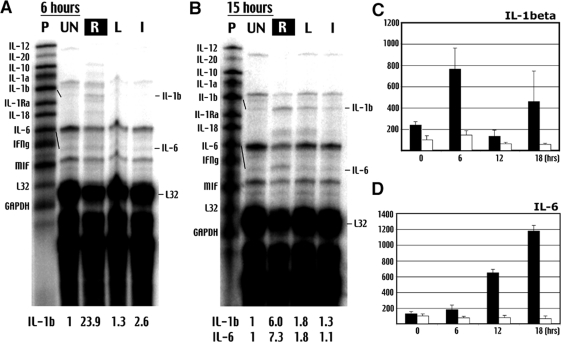
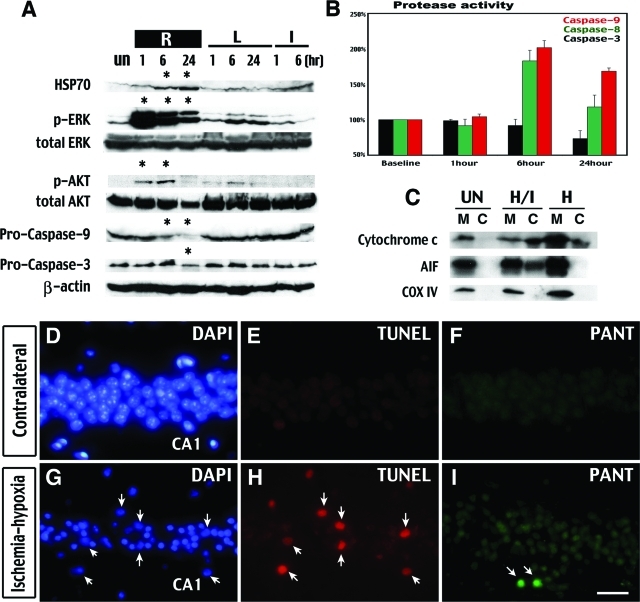
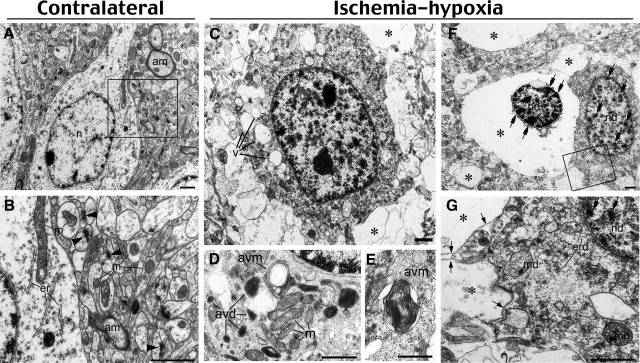
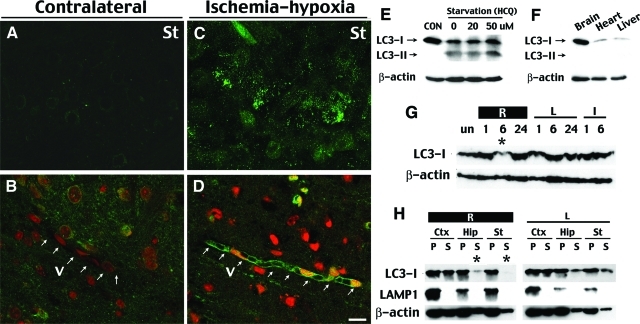
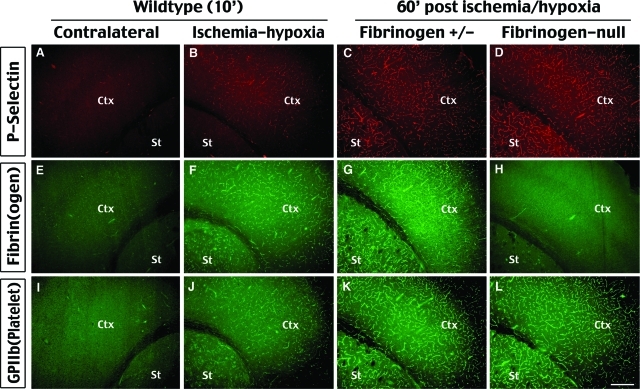
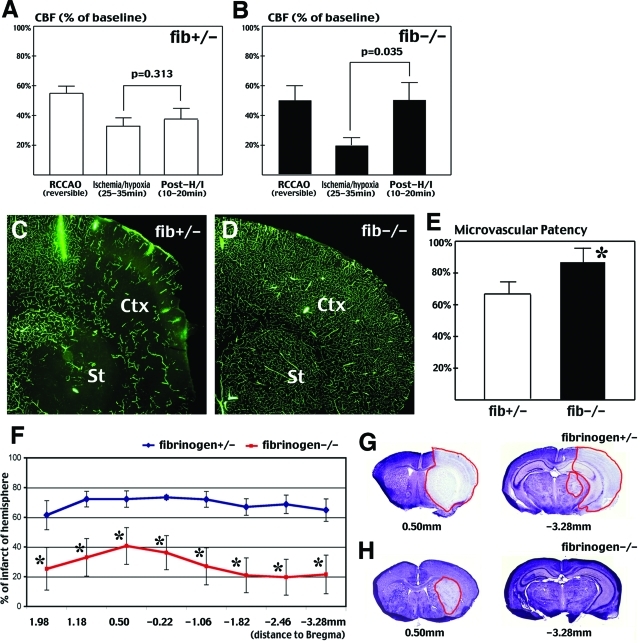
Hypoxia is a critical factor for cell death or survival in ischemic stroke, but the pathological consequences of combined ischemia-hypoxia are not fully understood. Here we examine this issue using a modified Levine/Vannucci procedure in adult mice that consists of unilateral common carotid artery occlusion and hypoxia with tightly regulated body temperature. At the cellular level, ischemia-hypoxia produced proinflammatory cytokines and simultaneously activated both prosurvival (eg, synthesis of heat shock 70 protein, phosphorylation of ERK and AKT) and proapoptosis signaling pathways (eg, release of cytochrome c and AIF from mitochondria, cleavage of caspase-9 and -8). However, caspase-3 was not activated, and very few cells completed the apoptosis process. Instead, many damaged neurons showed features of autophagic/lysosomal cell death. At the tissue level, ischemia-hypoxia caused persistent cerebral perfusion deficits even after release of the carotid artery occlusion. These changes were associated with both platelet deposition and fibrin accumulation within the cerebral circulation and would be expected to contribute to infarction. Complementary studies in fibrinogen-deficient mice revealed that the absence of fibrin and/or secondary fibrin-mediated inflammatory processes significantly attenuated brain damage. Together, these results suggest that ischemia-hypoxia is a powerful stimulus for spontaneous coagulation leading to reperfusion deficits and autophagic/lysosomal cell death in brain.


Figures

Figure 1-6925
Figure 1-6925
Carotid occlusion and 40-minute hypoxia produces consistent infarction. A: Outcomes of mortality (NDS = 5) and neurological deficits after different durations of hypoxia and survival times. The montage picture shows a mouse with a neurological deficit score (NDS) of 3 (small circling) and another with a NDS of 4 (immobilization). B–F: Quantification of the infarct area by Nissl staining on the surviving animals in conditions indicated in A. A hypoxic duration of 30 (E, F) and 35 minutes (C, D) produces smaller average infarct size and more variable brain damage in individual animals than 40-minute hypoxia (B). Eight rostral-to-caudal brain levels spanning from 2.0 to −3.2 mm to the Bregma point were analyzed. Open squares indicate results in individual animals; closed circles and bars indicate the average infarct size and the SE of each group, respectively.
Figure 2-6925
Figure 2-6925
Ischemia-hypoxia causes progression of brain infarction originating from the MCA territory and breakdown of the BBB. A and B: There is no extravasation of the Evans blue dye at 6 hours after ischemia-hypoxia, but the lateral ventricule on the presumptive lesion side consistently is reduced (arrow in B), indicating brain edema. C: TTC stain of brain slices shows the worst pathology of a group of eight mice at 6 hours after ischemia-hypoxia. Note the brain infarction was limited to the MCA territory including the striatum (St) and the rostral cerebral cortex (Ctx). D and E: Vast extravasation of the Evans blue dye and hemorrhagic transformation (arrows) by 24 hours after ischemia-hypoxia indicate the breakdown of the BBB. F: A representative T2-weighted MR image shows increased brain edema in a large portion of the hemisphere covering the cerebral cortex (Ctx), the striatum (St), and the thalamus (Th), but sparing the cerebellum (Cb). The severe brain edema causes a midline-shift and compression of the ventricles. G–I: Brain infarction exhibits as lack of TTC stain (G, H) and reduced Nissl’s stain (I) in structures as in F in addition to the hippocampus (Hip). J and M: Silver stain shows degeneration of the hippocampal pyramidal neurons on the lesion side (M), but not the contralateral side (J) at 24 hours after ischemia-hypoxia. K, L, N, and O: Golgi stain shows extensive degeneration of hippocampal pyramidal neurons (CA in N) and cortical neurons (Ctx in O). The hippocampus (K) and the cortex (L) on the contralateral side retain abundant axons and dendrites showing no signs of injury. Shown are the representative pictures of at least four mice for each staining. Scale bars: 1.5 mm (K, L, N, O); 300 μm (J, M).
Figure 3-6925
Figure 3-6925
Combined ischemia-hypoxia diminishes CBF and impedes reperfusion. A: Laser Doppler flowmetry shows 50% reduction of the baseline CBF and a fast reperfusion after release of the right common carotid artery occlusion (RCCAO). B: Hypoxia alone has little effect on the CBF. In contrast, the combination of RCCAO and hypoxia diminished the CBF to ∼20% of the normal value, which recovered poorly even with a reversible carotid occlusion (n > 3 for each condition). C: While the carotid artery pressure (BP) and flow (BF) are maintained at ∼60% of the baseline level, the cerebrovascular resistance (CVR) steadily increases during hypoxia. D: Measurement of the blood gas parameters (n = 5) and the mean arterial BP and HR (n = 3) indicates a transient change of all values that primarily recover at 30 minutes after hypoxia.
Figure 4-6925
Figure 4-6925
Perfusion deficits after ischemia-hypoxia are prolonged well into recovery. A and B: Intracardiac injection of FITC-dextran at 3 hours after ischemia-hypoxia fills vessels of the contralateral side of the brain (B), but is excluded in a large area including the striatum (St) and the cortex (Ctx) on the lesion side (C). FITC-dextran images are representative for six animals. C: Sequential magnetic resonance images (MRIs) of a mouse brain after RCCAO (left), at 30 minutes of hypoxia (center), and at 30 minutes of recovery of hypoxia (right). Top row is the relative CBF map measured by the arterial spin labeling method. Middle row is the corresponding ADC map. Bottom row is the T2-weighted image at the beginning and the end of MRI tracing. MRI tracing shows ADC reduction and prolonged T2-relaxation in the hemisphere ipsilateral to RCCAO. Details of the MR imaging sequences are provided in the Materials and Methods section. Scale bar = 1 mm.
Figure 5-6925
Figure 5-6925
Cerebral ischemia-hypoxia causes a bi-phasic pattern of cytokine induction. A and B: Ribonuclease protection assay shows early induction of IL-1β and delayed production of IL-6 transcripts after ischemia hypoxia. P, Free probe; UN, samples from unchallenged brains; R, ischemia-hypoxia-challenged/right side of the brain; L, contralateral/left side of brain, I, unilateral CCA occlusion/ischemia alone. The increase of transcript is quantified against the housekeeping gene L32. Shown is the representative data in three sets of experiments. C: The ELISA shows a bi-phasic increase of IL-1β on the ipsilateral side (filled columns), but not on the contralateral side of the brain (open columns) after ischemia-hypoxia. D: In contrast, IL-6 level increases gradually after ischemia-hypoxia. Shown are the average quantities with the SE in whole-brain samples at the indicated times after ischemia-hypoxia (hours) (n > 4 for each point).
Figure 6-6925
Figure 6-6925
Cerebral ischemia-hypoxia causes prosurvival signaling and aborted apoptosis in initially viable tissues. A: Immunoblot shows more pronounced accumulation of Hsp70 and phosphorylation of ERK and AKT in the hippocampus on the lesion side (R) than the contralateral side (L) at indicated times after ischemia-hypoxia or unilateral CCA occlusion (I). This is accompanied by a degradation of pro-caspase 3 and 9 on the lesion side (R). B: Protease activity assay shows increased caspase-9 and -8 activities, but not caspase-3 activity, at 6 and 24 hours after ischemia-hypoxia. C: Cell fractionation and Western blot analysis indicates the release of cytochrome c and AIF from the mitochondria (M) to the cytosol (C) in the hippocampus at 6 hours after ischemia-hypoxia. The purity of the mitochondria/cytosol fractioning is shown by immunoblotting against the cytochrome oxidase (COX) subunit IV. D–I: PANT stain shows single-strand DNA breaks in the CA1 region of the hippocampus at 24 hours after ischemia-hypoxia (I), with some TUNEL-positive cells detected in adjacent sections (H). Even fewer TUNEL-positive cells were detected in other regions of the brain. Biochemical data are representative of three sets of experiments with the sample pooled from at least three animals of each time point. PANT and TUNEL staining are representative for three animals analyzed at both 6 and 24 hours. Scale bar = 400 μm.
Figure 7-6925
Figure 7-6925
Ischemia-hypoxia induces vacuolization and lysis of cellular organelles. A and B: Contralateral hemisphere demonstrates normal structures of neuron cell body and neuropil. Notice homogenous nuclear chromatin (n), myelinated axons (am), intact mitochondria (m), cis-terns of endoplasmic reticulum (er), and numerous synapses (arrowheads). C–G: Damaged neurons in the cerebral cortex at 6 hours after ischemia-hypoxia show multiple vacuoles (v in C) in the cytoplasm and different degrees of cell destruction. Electron micrographs of the cytoplasm in less damaged neurons (D and E; notice intact mitochondria, m) exhibit autophagy-like vacuoles containing electron-dense material (avd) and whorls of membranous material (avm). In more advanced cell destruction, many cells demonstrate near-complete lysis of organelles (asterisks in C, F, and G), but the plasma membrane of such cells are preserved (arrows in G). Moderately damaged cells (G) display fragmented endoplasmic reticulum membranes (erd), condensed chromatin (double arrows) in damaged nuclei (nd), and swollen mitochondria (md) containing electron transparent matrix. Condensation of chromatin (double arrows in F and G) in damaged nuclei might be a result of proapoptotic reaction or represent aborted apoptosis. B and G represent enlarged framed areas in A and F, respectively. Scale bars: 1 μm (AC, F, G); 0.5 μm (D, E).
Figure 8-6925
Figure 8-6925
Cerebral ischemia-hypoxia causes redistribution of LC3 proteins indicating autophagy. A and C: At 6 to 18 hours after ischemia-hypoxia, some cells on the lesion side in the striatum (St) in transgenic GFP-LC3 mice display numerous bright, punctate fluorescent dots (C), whereas those on the contralateral side (A) and in the unchallenged brains (not shown) exhibit a dim and diffuse pattern of green fluorescence. B and D: At 18 hours after ischemia-hypoxia, many brain vessels (V) on the lesion side (D) express a higher level of GFP-LC3 fluorescence with punctate dots in the endothelial cells, whereas the blood vessels in the contralateral tissue (B) lack the fluorescence. A and C and B and D were photographed with a confocal microscope using the same laser strength. Nuclei in B and D are counterstained by ethidium homodimer-1 (red fluorescence). E: Immunoblot against LC3 in HEK293 cells in regular medium (10% fetal bovine serum in Dulbecco’s modified Eagle’s medium) or starvation medium [Hanks’ balanced salt solution with hydrochloroquine (HCQ) to inhibit the lysosomes] for 4 hours. Starvation caused a LC3-II band conversion as well as reduction of the LC3-I protein. F: Immunoblot showed that the brain in newborns has a higher lever of the LC3-I band compared to the heart and liver. G: Immunoblots of the extracts from lateral hemisphere showed a reduction of LC3 protein on the lesion side (R) at 6 hours after ischemia-hypoxia. H: Brain tissues were fractionated into supernatant (S) and pellet (P) after centrifugation at 100,000 × g, and subjected to LC3, LAMP-1 (a lysosome marker), and β-actin immunoblotting. This analysis shows a selective reduction of LC3 protein in the soluble fraction at 6 hours in the hippocampus (Hip) and the striatum (St) on the ischemia-hypoxia side, but not on the contralateral side. Immunoblot is representative of three independent experiments and images shown are representative for four mice at each time point. Scale bar = 10 μm.
Figure 9-6925
Figure 9-6925
Cerebral ischemia-hypoxia rapidly activates endothelial cells and induces coagulation. Immunostaining of P-selectin (A–D), fibrinogen (E–H), and GPIIb (I–L, a platelet surface marker) are performed at indicated times after ischemia-hypoxia. This analysis shows induction of P-selectin expression and fibrin(ogen) and platelet accumulation in the blood vessels in the striatum (St) and cortex (Ctx) on the lesion side (B, F, J), but not on the contralateral side (A, E, I), at 10 minutes after ischemia-hypoxia in wild-type mice. Notice the area of coagulation matches the area of reperfusion deficits in Figure 4C. Mice heterozygous for fibrinogen-null mutation show broad P-selectin expression (C), fibri(ogen) deposition (G), and platelet accumulation (K) at 1 hour after ischemia-hypoxia similar to the pattern in the wild-type mice (data not shown). Fibrinogen-null mice lacked fibrinogen deposition (H) while retaining P-selectin expression (D) and platelet accumulation (L) as their heterozygous littermates. Shown pictures are representative of three animals for each immunostaining. Scale bar = 200 μm.
Figure 10-6925
Figure 10-6925
Fibrin deposition is a major component of reperfusion impediment and subsequent infarction after cerebral ischemia-hypoxia. A and B: Laser Doppler flowmetry indicates that CBF significantly rebounds in fibrinogen-deficient mice (B) after ischemia-hypoxia, but not in their heterozygous littermates (A) (n = 3 for each genotype). Mice that died during hypoxia were excluded from this analysis. C and D: FITC-dextran infusion shows greater perfusion deficits in heterozygous fibrinogen-null (C) than homozygous fibrinogen-null (D) mice at 1 hour after ischemia-hypoxia. E: Quantification of the FITC-dextran fluorescence shows significantly greater microvascular patency at four different brain sections in the fibrinogen-null mice (n = 6 for each genotype; *P < 0.05). F–H: At 24 hours after right common carotid occlusion and 35-minute hypoxia, Nissl stain indicates significant reduction of brain infarction (*P < 0.05) in homozygous fibrinogen-null mice (red line, n = 6) than in heterozygous littermates (blue line, n = 4, excluding two cases of mortality). G and H: Nissl stain of representative sections shows a typical infarction pattern in fibrinogen heterozygous (G) mice and a limited infarction in homozygous fibrinogen-null mice (H).

Comment in

References

    1. Baron JC. Perfusion thresholds in human cerebral ischemia: historical perspective and therapeutic implications. Cerebrovasc Dis. 2001;11(Suppl 1):S2–S8. - PubMed
    1. Sobesky J, Zaro Weber O, Lehnhardt FG, Hesselmann V, Neveling M, Jacobs A, Heiss WD. Does the mismatch match the penumbra? Magnetic resonance imaging and positron emission tomography in early ischemic stroke. Stroke. 2005;36:980–985. - PubMed
    1. Yan SF, Mackman N, Kisiel W, Stern DM, Pinsky DJ. Hypoxia/hypoxemia-induced activation of the procoagulant pathways and the pathogenesis of ischemia-associated thrombosis. Arterioscler Thromb Vasc Biol. 1999;19:2029–2035. - PubMed
    1. Ten VS, Pinsky DJ. Endothelial response to hypoxia: physiologic adaptation and pathologic dysfunction. Curr Opin Crit Care. 2002;8:242–250. - PubMed
    1. Majno G, Ames AI, Chiang J, Wright R. No reflow after cerebral ischaemia. Lancet. 1967;2:569–570.

Publication types

MeSH terms