

Increased melanoma growth and metastasis spreading in mice overexpressing placenta growth factor
- PMID: 16877362
- PMCID: PMC1698793
- DOI: 10.2353/ajpath.2006.051041
Increased melanoma growth and metastasis spreading in mice overexpressing placenta growth factor
Abstract
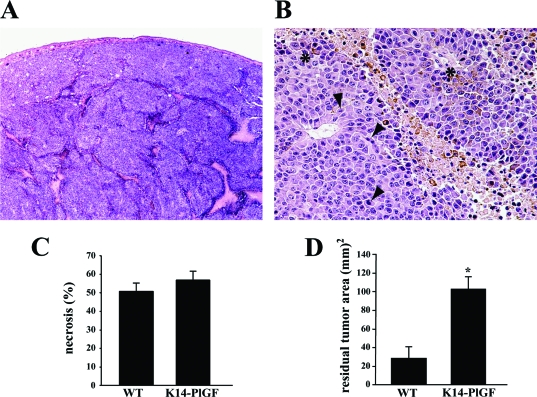
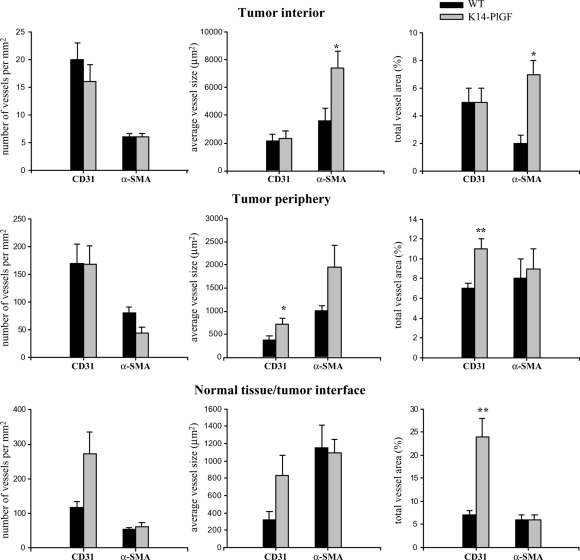
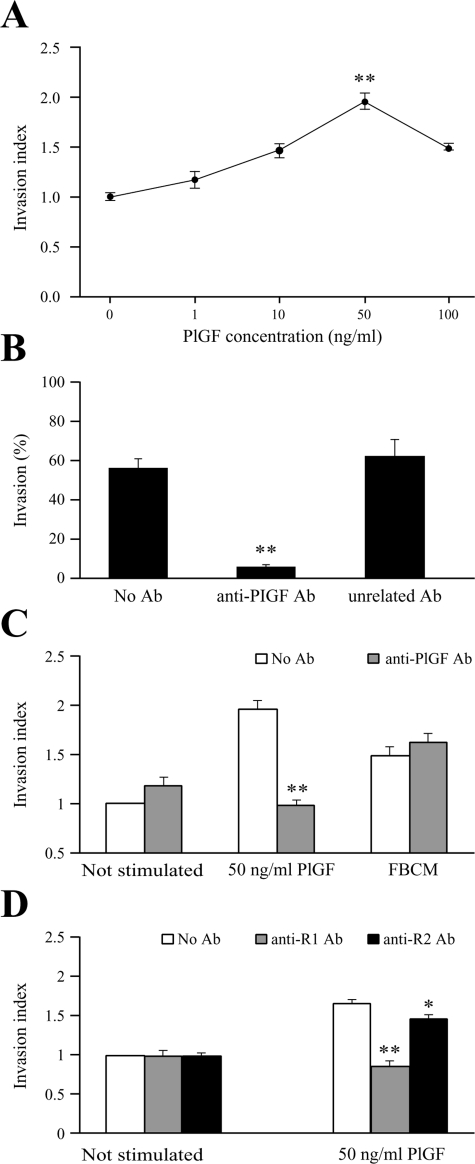
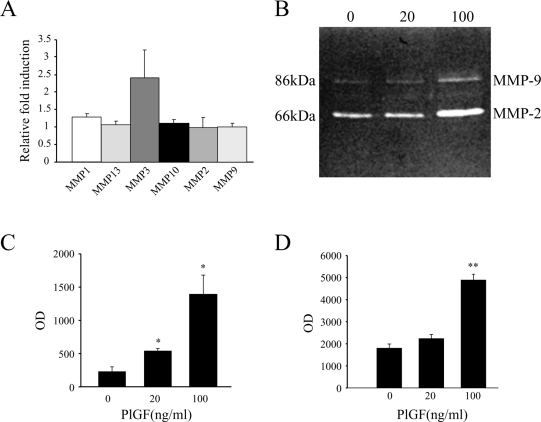
Placenta growth factor (PlGF), a member of the vascular endothelial growth factor family, plays an important role in adult pathological angiogenesis. To further investigate PlGF functions in tumor growth and metastasis formation, we used transgenic mice overexpressing PlGF in the skin under the control of the keratin 14 promoter. These animals showed a hypervascularized phenotype of the skin and increased levels of circulating PlGF with respect to their wild-type littermates. Transgenic mice and controls were inoculated intradermally with B16-BL6 melanoma cells. The tumor growth rate was fivefold increased in transgenic animals compared to wild-type mice, in the presence of a similar percentage of tumor necrotic tissue. Tumor vessel area was increased in transgenic mice as compared to controls. Augmented mobilization of endothelial and hematopoietic stem cells from the bone marrow was observed in transgenic animals, possibly contributing to tumor vascularization. The number and size of pulmonary metastases were significantly higher in transgenic mice compared to wild-type littermates. Finally, PlGF promoted tumor cell invasion of the extracellular matrix and increased the activity of selected matrix metalloproteinases. These findings indicate that PlGF, in addition to enhancing tumor angiogenesis and favoring tumor growth, may directly influence melanoma dissemination.
Figures


Similar articles
-
Mice overexpressing placenta growth factor exhibit increased vascularization and vessel permeability.J Cell Sci. 2002 Jun 15;115(Pt 12):2559-67. doi: 10.1242/jcs.115.12.2559. J Cell Sci. 2002. PMID: 12045226
-
Placenta growth factor in diabetic wound healing: altered expression and therapeutic potential.Am J Pathol. 2006 Oct;169(4):1167-82. doi: 10.2353/ajpath.2006.051314. Am J Pathol. 2006. PMID: 17003476 Free PMC article.
-
The placenta growth factor in skin angiogenesis.J Dermatol Sci. 2006 Jan;41(1):11-9. doi: 10.1016/j.jdermsci.2005.08.008. Epub 2005 Oct 10. J Dermatol Sci. 2006. PMID: 16216466 Review.
-
Treatment with low-dose interferon-alpha restores the balance between matrix metalloproteinase-9 and E-cadherin expression in human transitional cell carcinoma of the bladder.Clin Cancer Res. 2001 Sep;7(9):2840-53. Clin Cancer Res. 2001. PMID: 11555602
-
The possible role of angiogenesis in the metastatic potential of human melanoma. Clinicopathological aspects.Melanoma Res. 1993 Feb;3(1):5-14. doi: 10.1097/00008390-199304000-00002. Melanoma Res. 1993. PMID: 7682462 Review.
Cited by
-
Female Oncofertility and Immune Checkpoint Blockade in Melanoma: Where Are We Today?Cancers (Basel). 2025 Jan 13;17(2):238. doi: 10.3390/cancers17020238. Cancers (Basel). 2025. PMID: 39858020 Free PMC article. Review.
-
The Anti-Vascular Endothelial Growth Factor Receptor 1 (VEGFR-1) D16F7 Monoclonal Antibody Inhibits Melanoma Adhesion to Soluble VEGFR-1 and Tissue Invasion in Response to Placenta Growth Factor.Cancers (Basel). 2022 Nov 14;14(22):5578. doi: 10.3390/cancers14225578. Cancers (Basel). 2022. PMID: 36428669 Free PMC article.
-
B16-F10 melanoma cells contribute to the new formation of blood vessels in the chick embryo chorioallantoic membrane through vasculogenic mimicry.Clin Exp Med. 2013 May;13(2):143-7. doi: 10.1007/s10238-012-0183-8. Epub 2012 Apr 19. Clin Exp Med. 2013. PMID: 22527563
-
Neuropilin-1 as Therapeutic Target for Malignant Melanoma.Front Oncol. 2015 Jun 3;5:125. doi: 10.3389/fonc.2015.00125. eCollection 2015. Front Oncol. 2015. PMID: 26090340 Free PMC article. Review.
-
The multifaceted role of placental growth factor in the pathogenesis and progression of bronchial asthma and pulmonary fibrosis: Therapeutic implications.Genes Dis. 2022 Nov 14;10(4):1537-1551. doi: 10.1016/j.gendis.2022.10.017. eCollection 2023 Jul. Genes Dis. 2022. PMID: 37397552 Free PMC article. Review.
References
-
- Folkman J. Angiogenesis in cancer, vascular, rheumatoid and other disease. Nat Med. 1995;1:27–31. - PubMed
-
- Lyden D, Hattori K, Dias S, Costa C, Blaikie P, Butros L, Chadburn A, Hessing B, Marks W, Witte L, Wu Y, Hicklin D, Zhu Z, Hackett NR, Crystal RG, Moore MAS, Hajjar KA, Manova K, Benezra R, Rafii S. Impaired recruitment of bone-marrow-derived endothelial and hematopoietic precursor cells blocks tumor angiogenesis and growth. Nat Med. 2001;7:1194–1201. - PubMed
-
- Neufeld G, Tessler S, Gitay-Goren H, Cohen T, Levi B-Z. Vascular endothelial growth factor and its receptors. Prog Growth Factor Res. 1994;5:89–97. - PubMed
-
- Graeven U, Fiedler W, Karpinski S. Melanoma-associated expression of vascular endothelial growth factor and its receptors Flt-1 and KDR. J Cancer Res Clin Oncol. 1999;125:621–629. - PubMed
-
- Gitay-Goren H, Halaban R, Neufeld G. Human melanoma cells but not normal melanocytes express vascular endothelial growth factor receptors. Biochem Biophys Res Commun. 1993;190:702–709. - PubMed
Publication types
MeSH terms
Substances
LinkOut - more resources
Full Text Sources
Other Literature Sources
Medical
Molecular Biology Databases
