. 2006 Aug 8;103(32):11844-9.
doi: 10.1073/pnas.0604375103. Epub 2006 Jul 28.

Multiple-basin energy landscapes for large-amplitude conformational motions of proteins: Structure-based molecular dynamics simulations

Affiliations

Multiple-basin energy landscapes for large-amplitude conformational motions of proteins: Structure-based molecular dynamics simulations

Kei-ichi Okazaki et al. Proc Natl Acad Sci U S A. .

Abstract

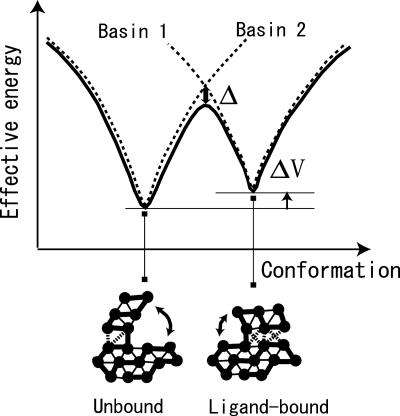
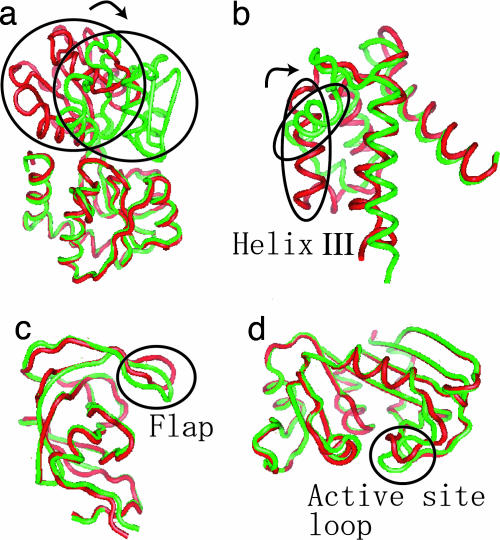
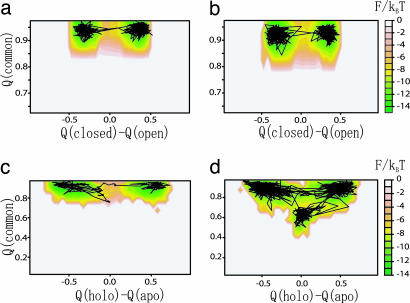
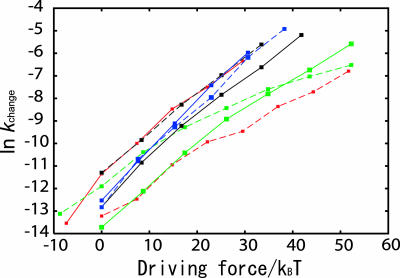
Biomolecules often undergo large-amplitude motions when they bind or release other molecules. Unlike macroscopic machines, these biomolecular machines can partially disassemble (unfold) and then reassemble (fold) during such transitions. Here we put forward a minimal structure-based model, the "multiple-basin model," that can directly be used for molecular dynamics simulation of even very large biomolecular systems so long as the endpoints of the conformational change are known. We investigate the model by simulating large-scale motions of four proteins: glutamine-binding protein, S100A6, dihydrofolate reductase, and HIV-1 protease. The mechanisms of conformational transition depend on the protein basin topologies and change with temperature near the folding transition. The conformational transition rate varies linearly with driving force over a fairly large range. This linearity appears to be a consequence of partial unfolding during the conformational transition.


Conflict of interest statement

Conflict of interest statement: No conflicts declared.

Figures

Fig. 1.
Fig. 1.
Schematic view of multiple-basin energy landscape of proteins. Two single funnels used for model construction are depicted by dashed lines. Conformational change is associated with the rearrangement of some contacts. Contacts specific to the unbound conformation are broken, and new contacts are formed in bound conformation. Thick solid bonds correspond to covalent linkages.
Fig. 2.
Fig. 2.
Conformational change of four proteins studied. (a) GBP. (b) S100A6. (c) HIV-1 protease. (d) DHFR. The red structures are those of unbound states (occluded in the case of DHFR), and the green structures are those of bound states (41).
Fig. 3.
Fig. 3.
Trajectories and free-energy profiles of conformational changes of GBP plotted for the reaction coordinate χ. (a) A trajectory with ΔV = 0 kBT. (b) A trajectory with ΔV = −4.4 kBT. (c) A trajectory with ΔV = −8.9 kBT. (d) The free-energy profiles for three different values of ΔV. The dotted curve corresponds to ΔV = −8.9 kBT, the solid curve corresponds to ΔV = −4.4 kBT, and the dashed curve corresponds to ΔV = 0 kBT. (e) Energetic 〈E〉 (dashed line) and entropic TS (solid line) contributions to the free-energy profile (dotted line) for the case of ΔV = −4.4 kBT.
Fig. 4.
Fig. 4.
Free-energy surfaces of conformational change of two proteins. (a) Conformational change of GBP. The y and x axes are the fraction of formed native contacts that are specific to the closed and open conformations, respectively. (b) Conformational change of S100A6. The y and x axes are a fraction of formed native contacts that are specific to the holo and apo conformations, respectively. A representative trajectory is superimposed.
Fig. 5.
Fig. 5.
Temperature dependence of conformational change dynamics of GBP and S100A6. The y axis is a fraction of formed native contacts that are common to two reference structures. The x axis is the difference between the fraction of native contacts specific to holo conformations and native contacts specific to apo conformations. (a) GBP T = 0.8 TF(open). (b) GBP T = 0.88 TF(open). (c) S100A6 T = 0.8 TF(apo). (d) S100A6 T = 0.88 TF(apo). Here TF(apo) is the folding transition temperature of the single Gō model funneled to the apo state. A representative trajectory is superimposed.
Fig. 6.
Fig. 6.
The transition rate constant as a function of the driving force of the conformational transition (Tafel plot). For each of four proteins, both transitions from unbound to bound (dashed lines) and those from bound to unbound (solid lines), were investigated. The vertical axis is the logarithm of the transition rate coefficient, and the horizontal axis is the driving force. The driving force is ±ΔV, where the sign is chosen so that the increase in the driving force corresponds to stabilize the final state. GBP is in red, S100A6 is in green, DHFR is in black, and HIV-1 protease is in blue.

References

    1. Daggett V. Protein Simulations. San Diego: Elsevier Academic; 2003.
    1. Tozzini V. Curr. Opin. Struct. Biol. 2005;15:144–150. - PubMed
    1. Ueda Y., Taketomi H., Go N. Int. J. Pept. Res. 1975;7:445–459. - PubMed
    1. Socci N. D., Onuchic J. N., Wolynes P. G. Proc. Natl. Acad. Sci. USA. 1999;96:2031–2035. - PMC - PubMed
    1. Takada S., Luthy-Schulten Z., Wolynes P. J. Chem. Phys. 1999;110:11616–11629.

Publication types