. 2006 Aug 8;103(32):12132-7.
doi: 10.1073/pnas.0603670103. Epub 2006 Jul 28.

The inflammatory NADPH oxidase enzyme modulates motor neuron degeneration in amyotrophic lateral sclerosis mice

Affiliations

The inflammatory NADPH oxidase enzyme modulates motor neuron degeneration in amyotrophic lateral sclerosis mice

Du-Chu Wu et al. Proc Natl Acad Sci U S A. .

Abstract

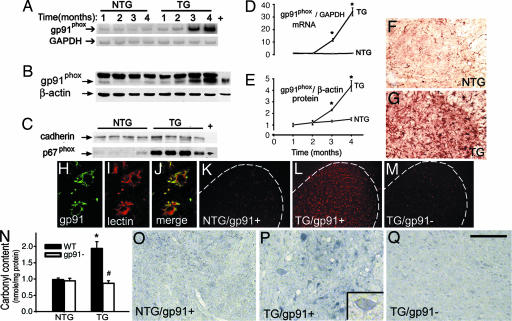
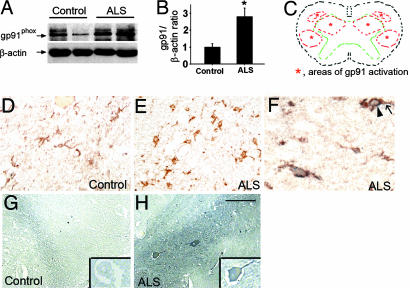
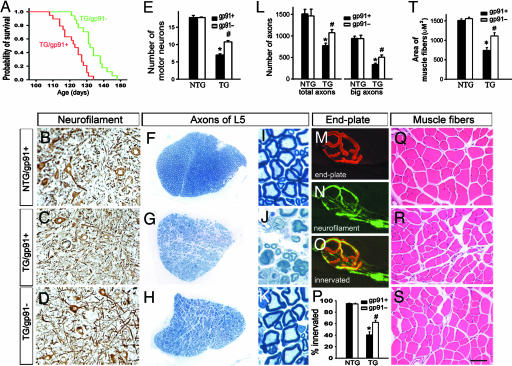
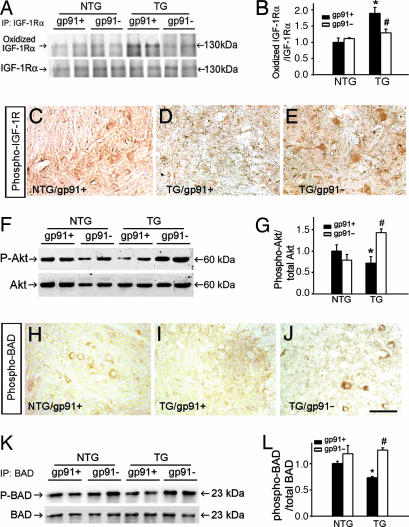
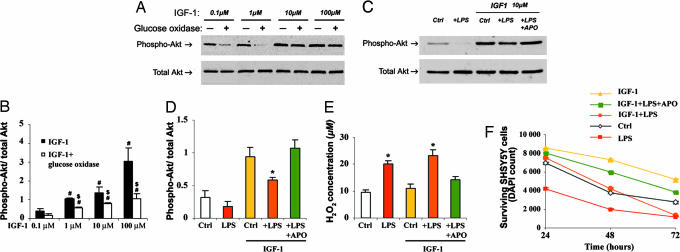
ALS is a fatal paralytic disorder characterized by a progressive loss of spinal cord motor neurons. Herein, we show that NADPH oxidase, the main reactive oxygen species-producing enzyme during inflammation, is activated in spinal cords of ALS patients and in spinal cords in a genetic animal model of this disease. We demonstrate that inactivation of NADPH oxidase in ALS mice delays neurodegeneration and extends survival. We also show that NADPH oxidase-derived oxidant products damage proteins such as insulin-like growth factor 1 (IGF1) receptors, which are located on motor neurons. Our in vivo and in vitro data indicate that such an oxidative modification hinders the IGF1/Akt survival pathway in motor neurons. These findings suggest a non-cell-autonomous mechanism through which inflammation could hasten motor neuron death and contribute to the selective motor neuronal degeneration in ALS.


Conflict of interest statement

Conflict of interest statement: No conflicts declared.

Figures

Fig. 1.
Fig. 1.
Microglial NADPH oxidase stimulates carbonylation of spinal cord motor neurons in transgenic SOD1G93A mice. (AE) Spinal cord gp91phox mRNA (A and D) and protein (B and E) in 1-month-old (asymptomatic) to 4-month-old (end-stage) transgenic SOD1G93A (TG) and nontransgenic (NTG) mice. (C) Spinal cord p67phox protein in 4-month-old TG SOD1G93A and NTG littermates. +, positive control (mouse macrophage lysate). (F and G) Spinal cord gp91phox immunohistochemistry in NTG (F) and TG (G) mice. (HJ) Confocal analysis of a TG spinal cord showing gp91phox in green (H) and the microglial marker ricinus communis agglutinin lectin in red (I); merged image is shown in J. (KM) Ethidium fluorescence (in red) in nontransgenic/gp91phox+ (NTG/gp91+) (K), transgenic SOD1G93A/gp91phox+ (TG/gp91+) (L), and transgenic SOD1G93A/gp91phox− (TG/gp91−) (M) spinal cords. (N) HPLC quantification of protein carbonyls in spinal cords from all four genotypes. (OQ) Immunohistochemistry for carbonyl adducts in NTG/gp91+ (O), TG/gp91+ (P), and TG/gp91− (Q) spinal cords by using an anti-dinitrophenylhydrazine antibody. (P Inset) Carbonylated motor neuron. Studies in FQ are in 4-month-old mice. Values (means ± SEM; n = 4–8 mice per group) were compared by ANOVA followed by Newman–Keuls post hoc testing. ∗, P < 0.05, more than NTG mice; #, P < 0.05, lower than TG/gp91+ mice. (Scale bar in Q: F and G, 0.4 mm; HJ, 40 μm; KM, 0.5 mm; OQ, 0.15 mm.)
Fig. 2.
Fig. 2.
NADPH oxidase is up-regulated and associated with motor neuron carbonylation in the spinal cord of sporadic ALS patients. (A and B) Immunoblots and bar graph for gp91phox using spinal cord extracts from six normal controls and six age-matched ALS patients. Values in B are means ± SEM and were compared by Student's t test. ∗, P < 0.05, higher than normal controls. (C) Drawing of a spinal cord transversal plan showing the gray matter (area delineated by the green dashed line) and the loci of degeneration in ALS (areas delineated by the red dashed line). (D and E) Spinal cord gp91phox immunohistochemistry in tissue sections from controls (D) and ALS patients (E). (F) In ALS patient samples, gp91phox-positive cells (arrow) exhibit a brown membrane labeling, which colocalizes with the blue-gray cytosol labeling for the microglial marker CD68 (arrowhead). (G and H) Immunohistochemical detection of carbonyl adducts in spinal cord sections of normal controls and age-matched ALS patients obtained by using the same technique as in Fig. 1 OQ. (Scale bar in H: D, E, G, and H, 0.2 mm; F, 0.5 mm.)
Fig. 3.
Fig. 3.
Deletion of gp91phox increases lifespan and lessens neurodegeneration in transgenic SOD1G93A mice. (A) Survival comparison of transgenic SOD1G93A/gp91phox+ mice (red) (122.0 ± 1.7 days; n = 19) and transgenic SOD1G93A/gp91phox− littermates (green) (135.2 ± 1.9 days; n = 17) (log-rank test = 15.3; P < 0.001). (BD) Immunohistochemistry for nonphosphorylated heavy-chain neurofilament in the spinal cord. (E) Quantification of large (≈25 μm) motor neurons per 14-μm-thick section from the fourth to fifth lumbar spinal cord segments. (FK) Toluidine blue-stained L5 anterior root sections. (L) Quantification of myelinated axons in fifth-lumbar (L5) anterior roots. (MP) Immunolabeling of the muscular acetylcholine receptor by an anti-α-bungarotoxin antibody (red) (M) and of the nerve terminals by an anti-heavy-chain neurofilament (green) (N) in the fibularis and peroneus longus muscles; the merged image (O) shows a normally innervated end plate. (P) Quantification of innervated end plates. (QS) H&E-stained fibularis and peroneus longus muscle sections. (T) Quantification of muscle fiber size. See the legend of Fig. 1 for abbreviations. Except for the survival analysis, mice were all 115 days old. In quantifications, values (means ± SEM; n = 4–6 mice per group) were compared by using ANOVA followed by Newman–Keuls post hoc testing. ∗, P < 0.05, lower than nontransgenic controls; #, P < 0.05, higher than transgenic SOD1G93A/gp91phox+ mice. (Scale bar in S: BD and FH, 80 μm; IK, 8 μm; MO, 15 μm; QS, 30 μm.)
Fig. 4.
Fig. 4.
Modulation of the IGF1/Akt pathway by NADPH oxidase-derived ROS. (A) Immunoprecipitation of IGF1 receptor α-chain followed by OxyBlot (upper blot) and immunoblot for spinal cord IGF1 receptor α-chain (lower blot). (B) Bar graph showing carbonylated/total α-chain ratios in the four genotypes shown in A. (CE) Immunostaining for spinal cord phospho-IGF1 receptor in the different mouse groups. (F) Spinal cord phospho-Akt (P-Akt) (upper blot) and total Akt (lower blot) immunoblots. (G) Bar graph showing P-Akt/total Akt ratios in the four genotypes in F. (HJ) Immunostaining for spinal cord phospho-BAD in the different mouse groups. (K) Immunoprecipitation of spinal cord BAD followed by immunoblot for phospho-BAD (P-BAD) (upper blot) and total BAD (lower blot). (L) Bar graph showing P-BAD/total BAD ratios in the four genotypes in K. The mice were all 115 days old. In the quantifications, values (means ± SEM; n = 4–8 mice per group) were compared by ANOVA followed by Newman–Keuls post hoc testing. ∗, P < 0.05, different from nontransgenic controls; #, P < 0.05, different from transgenic SOD1G93A/gp91phox+ mice. (Scale bar in J: CE and HJ, 0.2 mm.)
Fig. 5.
Fig. 5.
Glucose oxidase- and microglial-derived ROS impair the IGF1 Akt pathway in vitro. (A) Phospho-Akt (upper blot) and total Akt (lower blot) immunoblots of IGF1-treated SH-SY5Y cells exposed or not exposed to 75 μM glucose oxidase-generated H2O2. (B) Bar graph showing phospho-Akt/total Akt ratios for the different IGF1 doses. #, P < 0.05, higher than 0.1 μM IGF1; $, P < 0.05, lower than the same IGF1 concentration without glucose oxidase. (C) Phospho-Akt (upper blot) and total Akt (lower blot) immunoblots of SH-SY5Y cells exposed to various BV2 serum-free conditioned media supplemented or not supplemented with 10 μM IGF1. (D) Bar graph showing phospho-Akt/total Akt ratios. ∗, P < 0.05, lower than control and +LPS +APO in the IGF1-treated group. (E) Bar graph showing the H2O2 medium concentrations for the different conditions. ∗, P < 0.05, higher H2O2 concentration than controls and +LPS +APO. (F) SH-SY5Y survival kinetic over 72-h exposure to various BV2 serum-free conditioned media supplemented or not supplemented with 10 μM IGF1. APO, apocynin. Cell survival was assessed by counting DAPI-labeled normal nuclei and confirmed by 3-(4,5-dimethylthiazol-2-yl)-2,5-diphenyl tetrazolium bromide assay (data not shown). Data are averages of three or more independent experiments and were compared by ANOVA or repeated-measures ANOVA for the survival kinetic, followed by Newman–Keuls post hoc testing. For the survival kinetic, only LPS and IGF1 + LPS within the 72-h time point are not significantly different from each other (P = 0.386).

References

    1. Rowland L. P., Shneider N. A. N. Engl. J. Med. 2001;344:1688–1700. - PubMed
    1. Rosen D. R., Siddique T., Patterson D., Figlewicz D. A., Sapp P., Hentati A., Donaldson D., Goto J., O'Regan J. P., Deng H.-X., et al. Nature. 1993;362:59–62. - PubMed
    1. Deng H.-X., Hentati A., Tainer J. A., Iqbal Z., Cayabyab A., Hung W.-Y., Getzoff E. D., Hu P., Herzfeldt B., Roos R. P., et al. Science. 1993;261:1047–1051. - PubMed
    1. Julien J. P. Cell. 2001;104:581–591. - PubMed
    1. Clement A. M., Nguyen M. D., Roberts E. A., Garcia M. L., Boillee S., Rule M., McMahon A. P., Doucette W., Siwek D., Ferrante R. J., et al. Science. 2003;302:113–117. - PubMed

Publication types