. 2006 Sep;142(1):135-47.
doi: 10.1104/pp.106.086256. Epub 2006 Jul 28.

The effects of elevated CO2 concentration on soybean gene expression. An analysis of growing and mature leaves

Affiliations

The effects of elevated CO2 concentration on soybean gene expression. An analysis of growing and mature leaves

Elizabeth A Ainsworth et al. Plant Physiol. 2006 Sep.

Abstract

Improvements in carbon assimilation and water-use efficiency lead to increases in maximum leaf area index at elevated carbon dioxide concentration ([CO(2)]); however, the molecular drivers for this increase are unknown. We investigated the molecular basis for changes in leaf development at elevated [CO(2)] using soybeans (Glycine max) grown under fully open air conditions at the Soybean Free Air CO(2) Enrichment (SoyFACE) facility. The transcriptome responses of rapidly growing and fully expanded leaves to elevated [CO(2)] were investigated using cDNA microarrays. We identified 1,146 transcripts that showed a significant change in expression in growing versus fully expanded leaves. Transcripts for ribosomal proteins, cell cycle, and cell wall loosening, necessary for cytoplasmic growth and cell proliferation, were highly expressed in growing leaves. We further identified 139 transcripts with a significant [CO(2)] by development interaction. Clustering of these transcripts showed that transcripts involved in cell growth and cell proliferation were more highly expressed in growing leaves that developed at elevated [CO(2)] compared to growing leaves that developed at ambient [CO(2)]. The 327 [CO(2)]-responsive genes largely suggest that elevated [CO(2)] stimulates the respiratory breakdown of carbohydrates, which provides increased energy and biochemical precursors for leaf expansion and growth at elevated [CO(2)]. While increased photosynthesis and carbohydrate production at elevated [CO(2)] are well documented, this research demonstrates that at the transcript and metabolite level, respiratory breakdown of starch is also increased at elevated [CO(2)].


Figures

Figure 1.
Figure 1.
Design of the cDNA microarray experiment. Each double-headed arrow represents four microarrays per library, two biological replicates and two technical replicates. Each biological replicate included pooled RNA from six individual plants. A total of 96 microarrays were analyzed. Four treatments were compared: 1, T4 versus T6 in ambient [CO2] (T4A versus T6A); 2, T4 versus T6 in elevated [CO2] (T4E versus T6E); 3, T4 in ambient [CO2] versus T4 in elevated [CO2] (T4A versus T4E); 4, T6 in ambient [CO2] versus T6 in elevated [CO2] (T6A versus T6E).
Figure 2.
Figure 2.
Increase in length of the fourth (T4, circles) and sixth (T6, triangles) trifoliate lateral leaflets grown at ambient (A; white symbols) and elevated (E; black symbols) [CO2]. Samples for microarray analysis and leaf carbohydrates were taken on July 8, 2004, between 1 and 2 am, when T4 leaflets were fully expanded and T6 leaflets were expanding in length at 42% ± 6% d−1.
Figure 3.
Figure 3.
Leaf level contents of soluble carbohydrates (Suc, Glc, Fru; A and B) and starch (C and D) in fully expanded (T4) and growing (T6) leaves in ambient (A) and elevated (E) [CO2]. Leaves were sampled at dusk on July 7, 2004 (A and C), and between 1 and 2 am on July 8, 2004 (B and D). At dusk, there was a significant buildup of carbohydrates in mature leaves grown at elevated [CO2] (P < 0.05), but there was no significant effect of [CO2] treatment on soluble carbohydrates or starch (P > 0.05) in the middle of the night. There was a highly significant effect of development on both carbohydrate pools (P < 0.001).
Figure 4.
Figure 4.
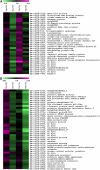
Heat map of transcripts with significant [CO2] × trifoliate interaction (P < 0.05). Transcripts were clustered into four distinct clusters (A–D) using k-means clustering (TIGR MeV version 3.1). Values for each ratio are expressed by color intensity, where higher expression is indicated by shades of magenta and lower expression by shades of green. Comparisons between [CO2] treatments and developmental stages are described in Figure 1.
Figure 4.
Figure 4.
Heat map of transcripts with significant [CO2] × trifoliate interaction (P < 0.05). Transcripts were clustered into four distinct clusters (A–D) using k-means clustering (TIGR MeV version 3.1). Values for each ratio are expressed by color intensity, where higher expression is indicated by shades of magenta and lower expression by shades of green. Comparisons between [CO2] treatments and developmental stages are described in Figure 1.
Figure 5.
Figure 5.
Categorical distribution of genes showing differential expression under elevated [CO2].
Figure 6.
Figure 6.
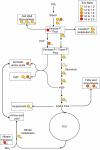
Graphical representation of selected gene transcripts up-regulated in response to growth at elevated [CO2]. The arrows and boxes indicate metabolic steps, pathways, or metabolite pools in central C and N metabolism. The colored dots indicate that a gene encoding an enzyme for that step or pathway is significantly up-regulated at elevated [CO2]. The color of the dot indicates the degree of up-regulation at elevated [CO2] relative to ambient [CO2] controls (E to A ratio): the darker the color, the greater the up-regulation (see insert). Each spot signifies an individual gene and is coded to the complete list of clones in Table II.

Similar articles

Cited by

References

    1. Abe T, Thitamadee S, Hashimoto T (2004) Microtubule defects and cell morphogenesis in the lefty1lefty2 tubulin mutant of Arabidopsis thaliana. Plant Cell Physiol 45: 211–220 - PubMed
    1. Ainsworth EA, Davey PA, Bernacchi CJ, Dermody OC, Heaton EA, Moore DJ, Morgan PB, Naidu SL, Ra HSY, Zhu XG, et al (2002) A meta-analysis of elevated [CO2] effects on soybean (Glycine max) physiology, growth and yield. Glob Change Biol 8: 695–709
    1. Ainsworth EA, Walter A, Schurr U (2005) Glycine max leaflets lack a base-tip gradient in growth rate. J Plant Res 118: 343–346 - PubMed
    1. Avery GS (1933) Structure and development of the tobacco leaf. Am J Bot 20: 565–592
    1. Bernacchi CJ, Leakey ADB, Heady LE, Morgan PB, Rogers A, Long SP, Ort DR (2006) Hourly and seasonal variation in photosynthesis and stomatal conductance of soybean grown at future CO2 and ozone concentrations for three years under fully open air conditions. Plant Cell Environ doi/10.1111/j.1365-3040.2006.01581.x - PubMed

Publication types

MeSH terms