

Integrin alphaIIbbeta3:ligand interactions are linked to binding-site remodeling
- PMID: 16877710
- PMCID: PMC2242588
- DOI: 10.1110/ps.052049506
Integrin alphaIIbbeta3:ligand interactions are linked to binding-site remodeling
Abstract
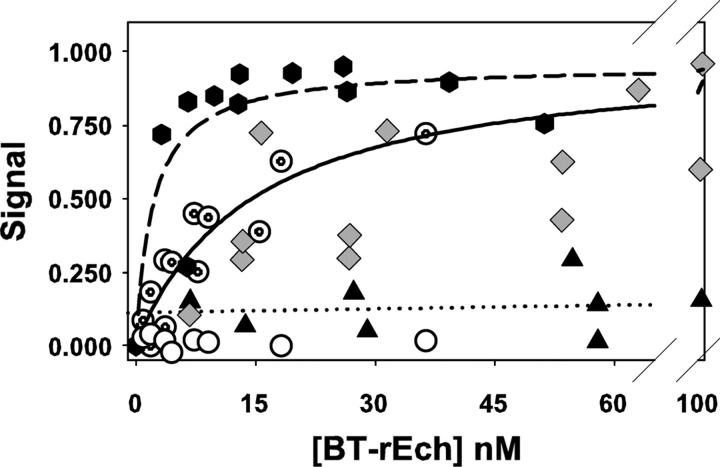
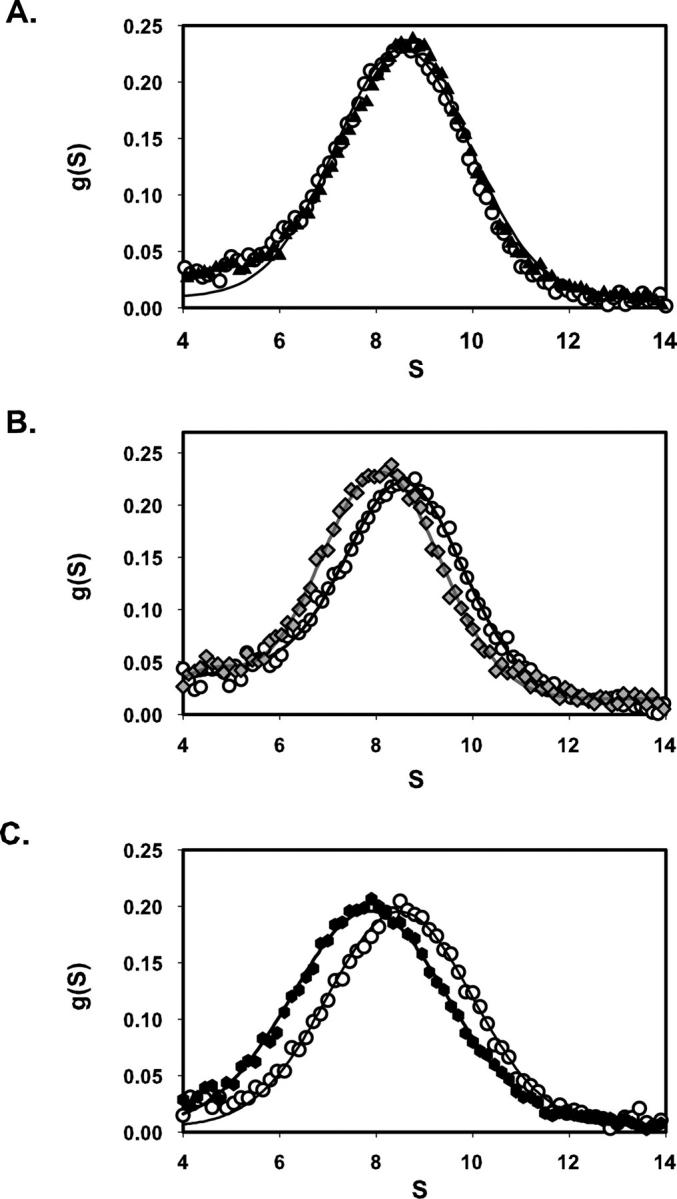
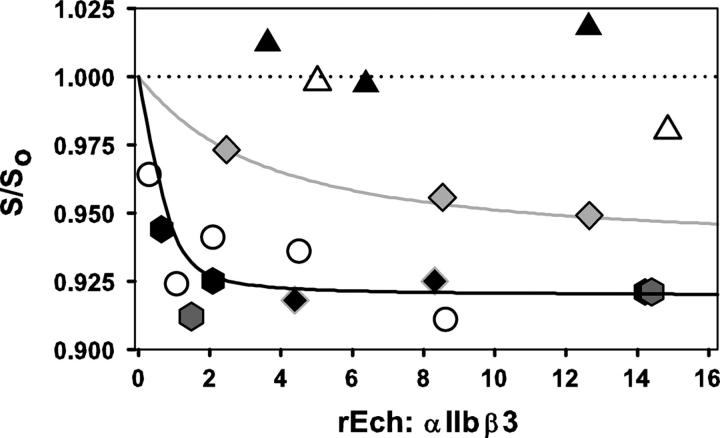
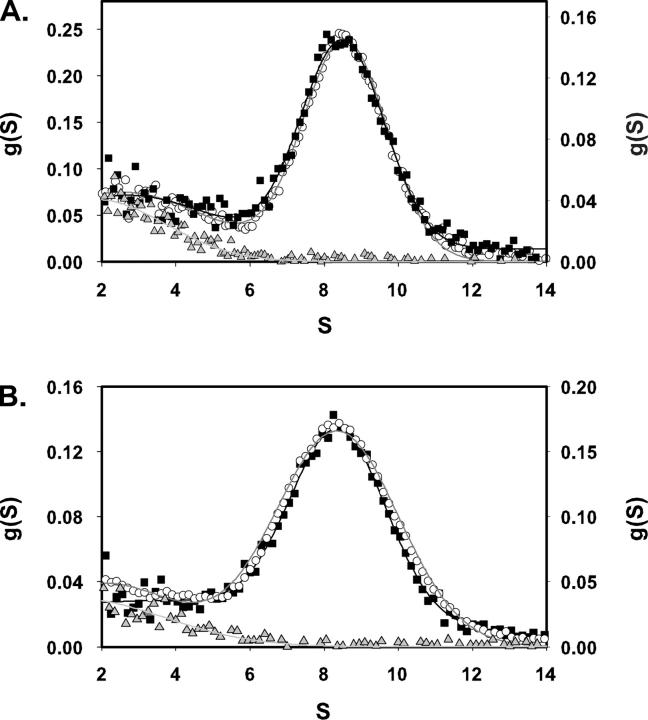
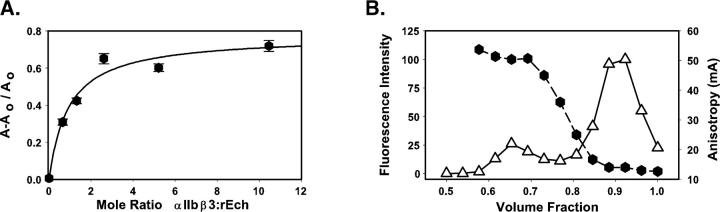
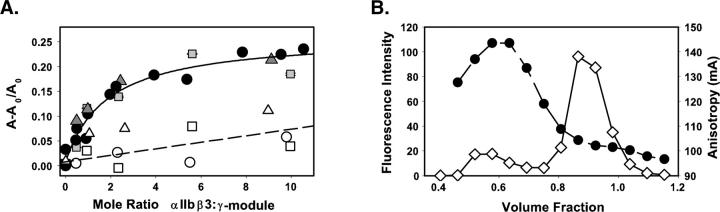
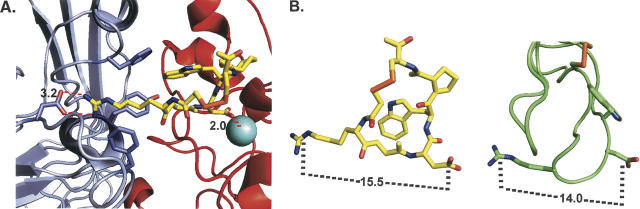
This study tested the hypothesis that high-affinity binding of macromolecular ligands to the alphaIIbbeta3 integrin is tightly coupled to binding-site remodeling, an induced-fit process that shifts a conformational equilibrium from a resting toward an open receptor. Interactions between alphaIIbbeta3 and two model ligands-echistatin, a 6-kDa recombinant protein with an RGD integrin-targeting sequence, and fibrinogen's gamma-module, a 30-kDa recombinant protein with a KQAGDV integrin binding site-were measured by sedimentation velocity, fluorescence anisotropy, and a solid-phase binding assay, and modeled by molecular graphics. Studying echistatin variants (R24A, R24K, D26A, D26E, D27W, D27F), we found that electrostatic contacts with charged residues at the alphaIIb/beta3 interface, rather than nonpolar contacts, perturb the conformation of the resting integrin. Aspartate 26, which interacts with the nearby MIDAS cation, was essential for binding, as D26A and D26E were inactive. In contrast, R24K was fully and R24A partly active, indicating that the positively charged arginine 24 contributes to, but is not required for, integrin recognition. Moreover, we demonstrated that priming--i.e., ectodomain conformational changes and oligomerization induced by incubation at 35 degrees C with the ligand-mimetic peptide cHarGD--promotes complex formation with fibrinogen's gamma-module. We also observed that the gamma-module's flexible carboxy terminus was not required for alphaIIbbeta3 integrin binding. Our studies differentiate priming ligands, which bind to the resting receptor and perturb its conformation, from regulated ligands, where binding-site remodeling must first occur. Echistatin's binding energy is sufficient to rearrange the subunit interface, but regulated ligands like fibrinogen must rely on priming to overcome conformational barriers.
Figures
Similar articles
-
The disintegrin echistatin stabilizes integrin alphaIIbbeta3's open conformation and promotes its oligomerization.J Mol Biol. 2004 Oct 1;342(5):1625-36. doi: 10.1016/j.jmb.2004.08.009. J Mol Biol. 2004. PMID: 15364586
-
Binding of a fibrinogen mimetic stabilizes integrin alphaIIbbeta3's open conformation.Protein Sci. 2001 Aug;10(8):1614-26. doi: 10.1110/ps.3001. Protein Sci. 2001. PMID: 11468358 Free PMC article.
-
Dynamic regulation of fibrinogen: integrin αIIbβ3 binding.Biochemistry. 2010 Nov 2;49(43):9217-25. doi: 10.1021/bi1009858. Biochemistry. 2010. PMID: 20828133 Free PMC article.
-
RGD, the Rho'd to cell spreading.Eur J Cell Biol. 2006 Apr;85(3-4):249-54. doi: 10.1016/j.ejcb.2005.08.003. Epub 2005 Sep 13. Eur J Cell Biol. 2006. PMID: 16546569 Review.
-
Regulation of integrins in platelets.Biopolymers. 2015 Jul;104(4):323-33. doi: 10.1002/bip.22679. Biopolymers. 2015. PMID: 26010651 Review.
Cited by
-
Synthesis and evaluation of new iRGD peptide analogs for tumor optical imaging.Bioorg Med Chem Lett. 2011 Feb 15;21(4):1146-50. doi: 10.1016/j.bmcl.2010.12.112. Epub 2010 Dec 28. Bioorg Med Chem Lett. 2011. PMID: 21251820 Free PMC article.
-
Functional and computational studies of the ligand-associated metal binding site of beta3 integrins.Proteins. 2008 Jun;71(4):1779-91. doi: 10.1002/prot.21859. Proteins. 2008. PMID: 18175315 Free PMC article.
-
Recombinant and Chimeric Disintegrins in Preclinical Research.Toxins (Basel). 2018 Aug 7;10(8):321. doi: 10.3390/toxins10080321. Toxins (Basel). 2018. PMID: 30087285 Free PMC article. Review.
-
Dissociation of bimolecular αIIbβ3-fibrinogen complex under a constant tensile force.Biophys J. 2011 Jan 5;100(1):165-73. doi: 10.1016/j.bpj.2010.11.019. Biophys J. 2011. PMID: 21190668 Free PMC article.
-
Influence of "Flexible" versus "Rigid" Nanoparticles on the Stability of Matrix Metalloproteinase-7.J Biomed Nanotechnol. 2008 Dec 1;4(4):457-462. doi: 10.1166/jbn.2008.010. J Biomed Nanotechnol. 2008. PMID: 19956790 Free PMC article.
References
-
- Arnaout M.A., Goodman S.L., Xiong J.-P. 2002. Coming to grips with integrin binding to ligands. Curr. Opin. Cell Biol. 14: 641–651. - PubMed
-
- Beglova N., Blacklow S.C., Takagi J., Springer T.A. 2002. Cysteine-rich module structure reveals a fulcrum for integrin rearrangement upon activation. Nat. Struct. Biol. 9: 282–287. - PubMed
-
- Boersma E. and Westerhout C.M. 2004. Intravenous glycoprotein IIb/IIIa inhibitors in acute coronary syndromes: Lessons from recently conducted randomized clinical trials. Curr. Opin. Investig. Drugs 5: 313–319. - PubMed
Publication types
MeSH terms
Substances
Grants and funding
LinkOut - more resources
Full Text Sources
