

An amino acid "transmembrane tendency" scale that approaches the theoretical limit to accuracy for prediction of transmembrane helices: relationship to biological hydrophobicity
- PMID: 16877712
- PMCID: PMC2242586
- DOI: 10.1110/ps.062286306
An amino acid "transmembrane tendency" scale that approaches the theoretical limit to accuracy for prediction of transmembrane helices: relationship to biological hydrophobicity
Abstract
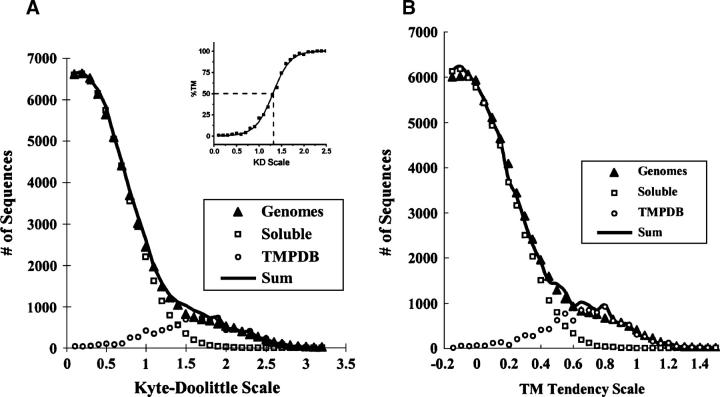
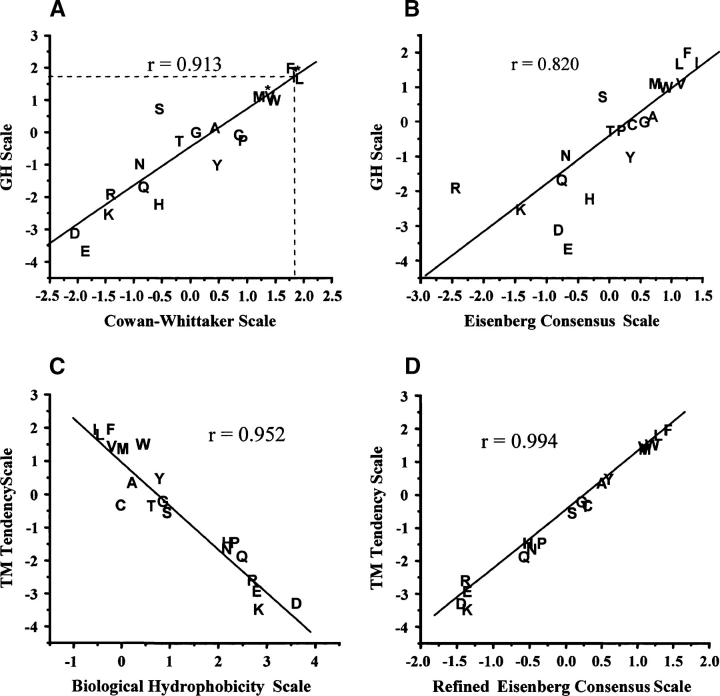
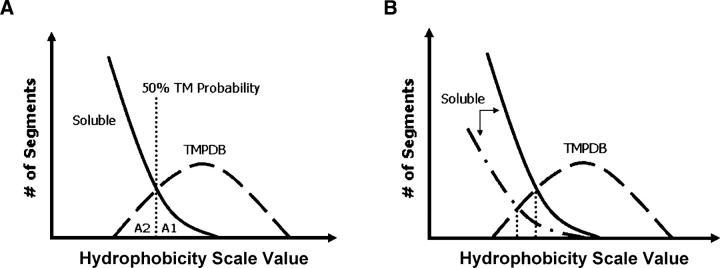
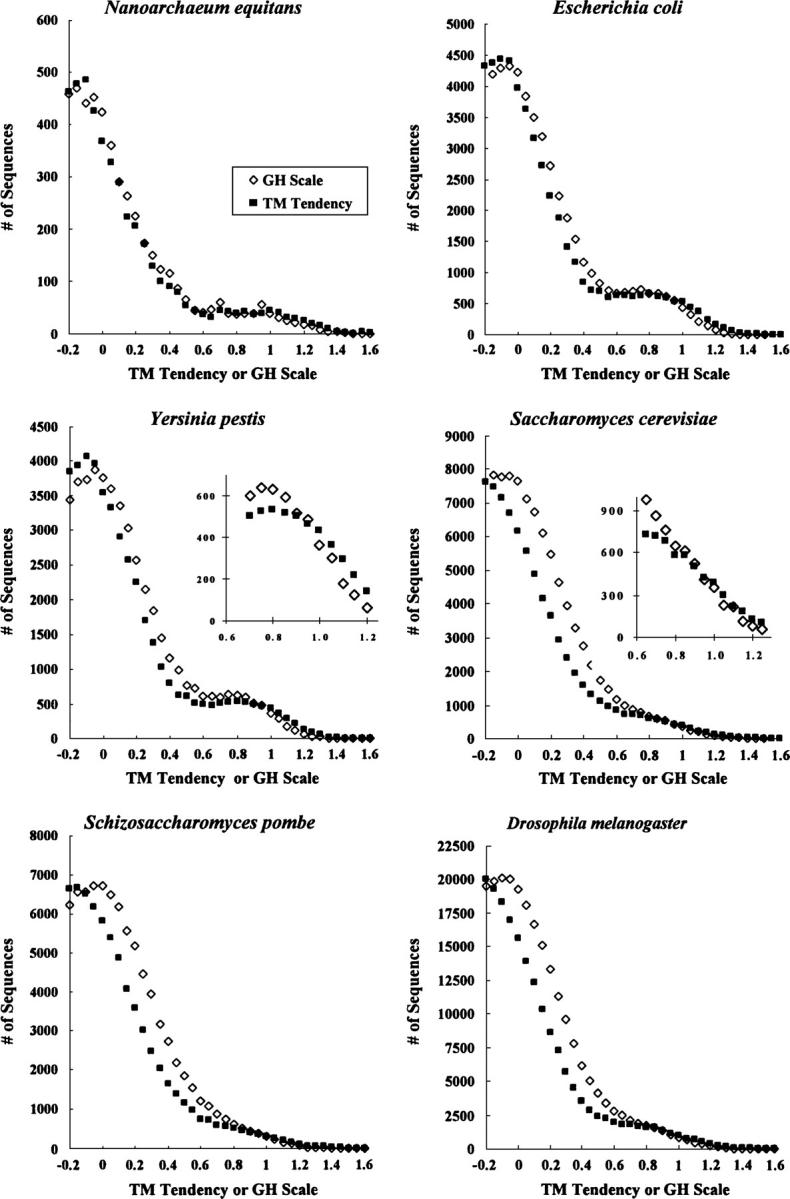
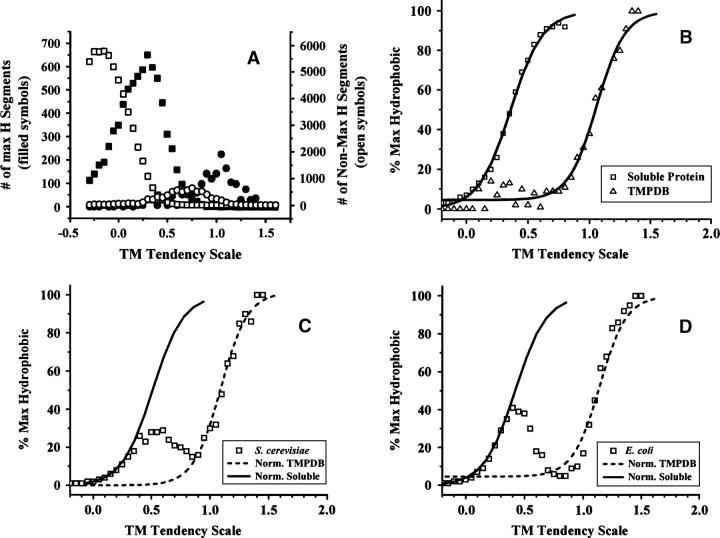
Hydrophobicity analyses applied to databases of soluble and transmembrane (TM) proteins of known structure were used to resolve total genomic hydrophobicity profiles into (helical) TM sequences and mainly "subhydrophobic" soluble components. This information was used to define a refined "hydrophobicity"-type TM sequence prediction scale that should approach the theoretical limit of accuracy. The refinement procedure involved adjusting scale values to eliminate differences between the average amino acid composition of populations TM and soluble sequences of equal hydrophobicity, a required property of a scale having maximum accuracy. Application of this procedure to different hydrophobicity scales caused them to collapse to essentially a single TM tendency scale. As expected, when different scales were compared, the TM tendency scale was the most accurate at predicting TM sequences. It was especially highly correlated (r = 0.95) to the biological hydrophobicity scale, derived experimentally from the percent TM conformation formed by artificial sequences passing though the translocon. It was also found that resolution of total genomic sequence data into TM and soluble components could be used to define the percent probability that a sequence with a specific hydrophobicity value forms a TM segment. Application of the TM tendency scale to whole genomic data revealed an overlap of TM and soluble sequences in the "semihydrophobic" range. This raises the possibility that a significant number of proteins have sequences that can switch between TM and non-TM states. Such proteins may exist in moonlighting forms having properties very different from those of the predominant conformation.
Figures
Similar articles
-
Why is the biological hydrophobicity scale more accurate than earlier experimental hydrophobicity scales?Proteins. 2014 Sep;82(9):2190-8. doi: 10.1002/prot.24582. Epub 2014 Apr 29. Proteins. 2014. PMID: 24753217
-
50 years of amino acid hydrophobicity scales: revisiting the capacity for peptide classification.Biol Res. 2016 Jul 4;49(1):31. doi: 10.1186/s40659-016-0092-5. Biol Res. 2016. PMID: 27378087 Free PMC article.
-
Energetics, stability, and prediction of transmembrane helices.J Mol Biol. 2001 Oct 5;312(5):927-34. doi: 10.1006/jmbi.2001.5008. J Mol Biol. 2001. PMID: 11580239
-
Hydrophobicity scales: a thermodynamic looking glass into lipid-protein interactions.Trends Biochem Sci. 2011 Dec;36(12):653-62. doi: 10.1016/j.tibs.2011.08.003. Epub 2011 Sep 18. Trends Biochem Sci. 2011. PMID: 21930386 Review.
-
Experimental measures of amino acid hydrophobicity and the topology of transmembrane and globular proteins.J Gen Physiol. 2007 May;129(5):357-62. doi: 10.1085/jgp.200709743. Epub 2007 Apr 16. J Gen Physiol. 2007. PMID: 17438117 Free PMC article. Review. No abstract available.
Cited by
-
Massively parallel interrogation of protein fragment secretability using SECRiFY reveals features influencing secretory system transit.Nat Commun. 2021 Nov 5;12(1):6414. doi: 10.1038/s41467-021-26720-y. Nat Commun. 2021. PMID: 34741024 Free PMC article.
-
Towards an experimental classification system for membrane active peptides.Sci Rep. 2018 Jan 19;8(1):1194. doi: 10.1038/s41598-018-19566-w. Sci Rep. 2018. PMID: 29352252 Free PMC article.
-
The two transmembrane regions of Candida albicans Dfi1 contribute to its biogenesis.Biochem Biophys Res Commun. 2017 Jun 17;488(1):153-158. doi: 10.1016/j.bbrc.2017.04.158. Epub 2017 May 5. Biochem Biophys Res Commun. 2017. PMID: 28483525 Free PMC article.
-
Comparison of amino acids physico-chemical properties and usage of late embryogenesis abundant proteins, hydrophilins and WHy domain.PLoS One. 2014 Oct 8;9(10):e109570. doi: 10.1371/journal.pone.0109570. eCollection 2014. PLoS One. 2014. PMID: 25296175 Free PMC article.
-
Sequence-based features that are determinant for tail-anchored membrane protein sorting in eukaryotes.Traffic. 2021 Sep;22(9):306-318. doi: 10.1111/tra.12809. Epub 2021 Aug 3. Traffic. 2021. PMID: 34288289 Free PMC article.
References
-
- Bechinger B. 1996. Towards membrane protein design: pH-sensitive topology of histidine-containing polypeptides. J. Mol. Biol. 263: 768–775. - PubMed
-
- Blattner F.R., Plunkett G. III, Bloch C.A., Perna N.T., Burland V., Riley M., Collado-Vides J., Glasner J.D., Rode C.K., Mayhew G.F. et al. 1997. The complete genome sequence of Escherichia coli K-12. Science 277: 1453–1474. - PubMed
-
- Caputo G.A. and London E. 2003. Cumulative effects of amino acid substitutions and hydrophobic mismatch upon the transmembrane stability and conformation of hydrophobic α-helices. Biochemistry 42: 3275–3285. - PubMed
Publication types
MeSH terms
Substances
Grants and funding
LinkOut - more resources
Full Text Sources
Other Literature Sources
Molecular Biology Databases
Research Materials
