

LINE-1 hypomethylation in a choline-deficiency-induced liver cancer in rats: dependence on feeding period
- PMID: 16877811
- PMCID: PMC1479888
- DOI: 10.1155/JBB/2006/17142
LINE-1 hypomethylation in a choline-deficiency-induced liver cancer in rats: dependence on feeding period
Abstract
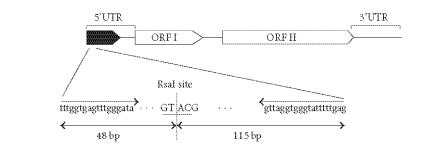
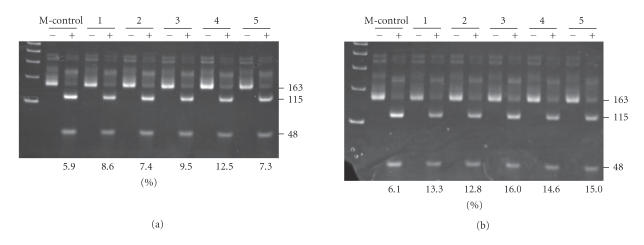
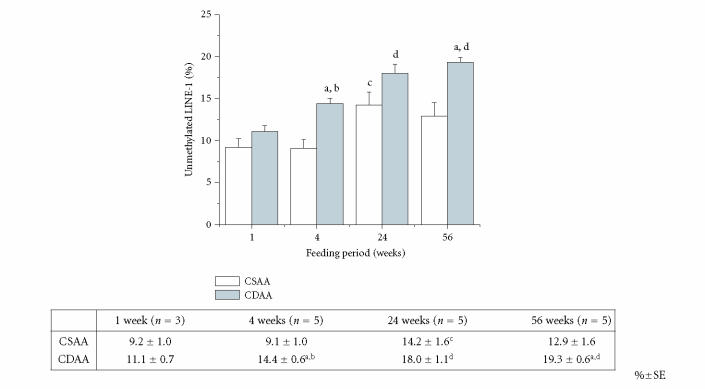
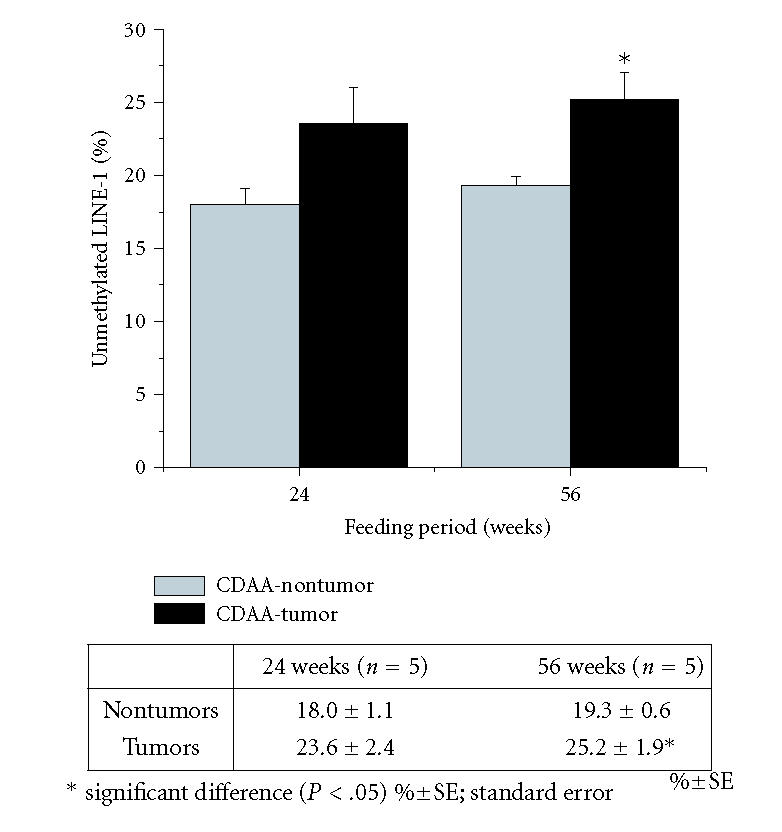
Chronic feeding of methyl-donor (methionine, choline, folic acid, and vitamin B12) deficient diet induces hepatocellular carcinoma formation in rats. Previous studies have shown that promoter CpG islands in various cancer-related genes are aberrantly methylated in this model. Moreover, the global genome in methyl-donor-deficient diet fed rats contains a lesser amount of 5-methylcytosine than control livers. It is speculated that more than 90% of all 5-methylcytosines lie within the CpG islands of the transposons, including the long/short interspersed nucleotide elements (LINE and SINE). It is considered that the 5-methylcytosines in LINE-1 limit the ability of retrotransposons to be activated and transcribed; therefore, the extent of hypomethylation of LINE-1 could be a surrogate marker for aberrant methylation in other tumor-related genes as well as genome instability. Additionally, LINE-1 methylation status has been shown to be a good indicator of genome-wide methylation. In this study, we determined cytosine methylation status in the LINE-1 repetitive sequences of rats fed a choline-deficient (CD) diet for various durations and compared these with rats fed a choline-sufficient (CS) diet. The methylation status of LINE-1 was assessed by the combined bisulfite restriction analysis (COBRA) method, where the amount of bisulfite-modified and RsaI-cleaved DNA was quantified using gel electrophoresis. Progressive hypomethylation was observed in LINE-1 of CD livers as a function of feeding time; that is, the amount of cytosine in total cytosine (methylated and unmethylated) increased from 11.1% (1 week) to 19.3% (56 weeks), whereas in the control CS livers, it increased from 9.2% to 12.9%. Hypomethylation in tumor tissues was slightly higher (6%) than the nontumorous surrounding tissue. The present result also indicates that age is a factor influencing the extent of cytosine methylation.
Figures
Similar articles
-
Differential sensitivity to loss of cytosine methyl groups within the hepatic p53 gene of folate/methyl deficient rats.Carcinogenesis. 1995 Nov;16(11):2863-7. doi: 10.1093/carcin/16.11.2863. Carcinogenesis. 1995. PMID: 7586211
-
Role of DNA damage and alterations in cytosine DNA methylation in rat liver carcinogenesis induced by a methyl-deficient diet.Mutat Res. 2009 Oct 2;669(1-2):56-62. doi: 10.1016/j.mrfmmm.2009.05.003. Epub 2009 May 13. Mutat Res. 2009. PMID: 19442675
-
Hypomethylation of the rat glutathione S-transferase pi (GSTP) promoter region isolated from methyl-deficient livers and GSTP-positive liver neoplasms.Carcinogenesis. 1998 Aug;19(8):1487-94. doi: 10.1093/carcin/19.8.1487. Carcinogenesis. 1998. PMID: 9744547
-
Effects of vitamin B12 and folate deficiencies on DNA methylation and carcinogenesis in rat liver.Clin Chem Lab Med. 2003 Aug;41(8):1012-9. doi: 10.1515/CCLM.2003.155. Clin Chem Lab Med. 2003. PMID: 12964806 Review.
-
Is DNA methylation the new guardian of the genome?Mol Cytogenet. 2017 Apr 4;10:11. doi: 10.1186/s13039-017-0314-8. eCollection 2017. Mol Cytogenet. 2017. PMID: 28396696 Free PMC article. Review.
Cited by
-
Loci-specific differences in blood DNA methylation in HBV-negative populations at risk for hepatocellular carcinoma development.Epigenetics. 2018;13(6):605-626. doi: 10.1080/15592294.2018.1481706. Epub 2018 Jul 30. Epigenetics. 2018. PMID: 29927686 Free PMC article.
-
Epigenetic mechanisms in anti-cancer actions of bioactive food components--the implications in cancer prevention.Br J Pharmacol. 2012 Sep;167(2):279-97. doi: 10.1111/j.1476-5381.2012.02002.x. Br J Pharmacol. 2012. PMID: 22536923 Free PMC article. Review.
-
Bisulfite oligonucleotide-capture sequencing for targeted base- and strand-specific absolute 5-methylcytosine quantitation.Age (Dordr). 2016 Jun;38(3):49. doi: 10.1007/s11357-016-9914-1. Epub 2016 Apr 18. Age (Dordr). 2016. PMID: 27091453 Free PMC article.
-
Low doses of the carcinogen furan alter cell cycle and apoptosis gene expression in rat liver independent of DNA methylation.Environ Health Perspect. 2010 Nov;118(11):1597-602. doi: 10.1289/ehp.1002153. Environ Health Perspect. 2010. PMID: 20562052 Free PMC article.
-
Alu and LINE-1 methylation and lung function in the normative ageing study.BMJ Open. 2012 Oct 17;2(5):e001231. doi: 10.1136/bmjopen-2012-001231. Print 2012. BMJ Open. 2012. PMID: 23075571 Free PMC article.
References
-
- Poirier LA. The role of methionine in carcinogenesis in vivo. Advances in Experimental Medicine and Biology. 1986;206:269–282. - PubMed
-
- Perera MI, Betschart JM, Virji MA, Katyal SL, Shinozuka H. Free radical injury and liver tumor promotion. Toxicologic Pathology. 1987;15(1):51–59. - PubMed
-
- Zeisel SH, da Costa KA, Albright CD, Shin OH. Choline and hepatocarcinogenesis in the rat. Advances in Experimental Medicine and Biology. 1995;375:65–74. - PubMed
-
- Nakae D. Endogenous liver carcinogenesis in the rat. Pathology International. 1999;49(12):1028–1042. - PubMed
-
- Ghoshal AK, Farber E. Liver biochemical pathology of cho-line deficiency and of methyl group deficiency: a new orientation and assessment. Histology and Histopathology. 1995;10(2):457–462. - PubMed
Grants and funding
LinkOut - more resources
Full Text Sources
