Comparative Study
. 2006 Sep;38(9):1060-5.
doi: 10.1038/ng1855. Epub 2006 Jul 30.

Augmentation of tumor angiogenesis by a Myc-activated microRNA cluster

Affiliations
Comparative Study

Augmentation of tumor angiogenesis by a Myc-activated microRNA cluster

Michael Dews et al. Nat Genet. 2006 Sep.

Abstract

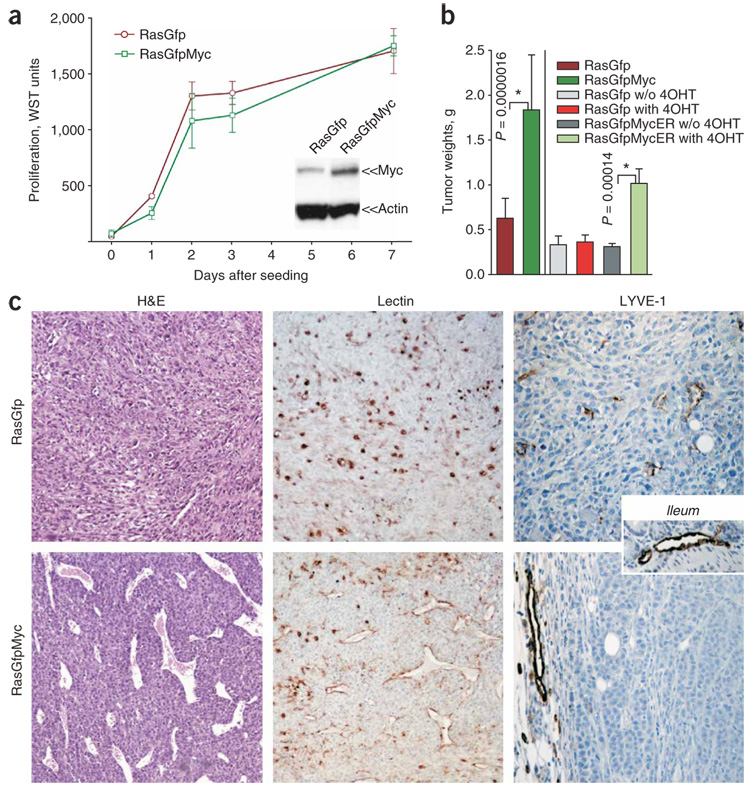
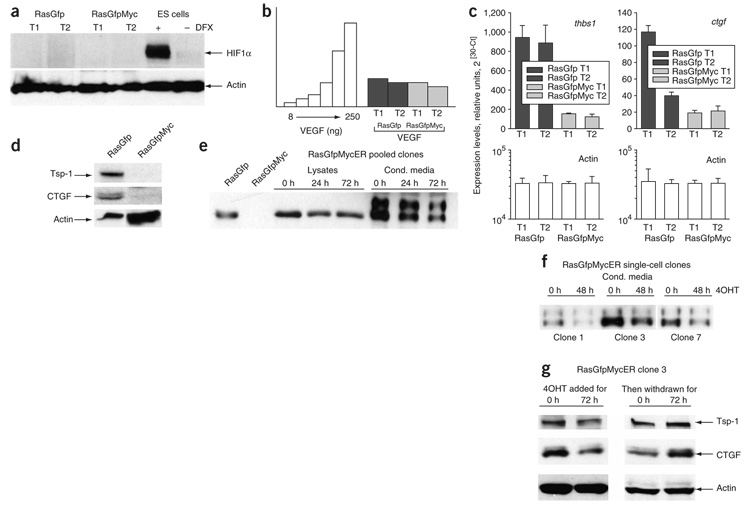
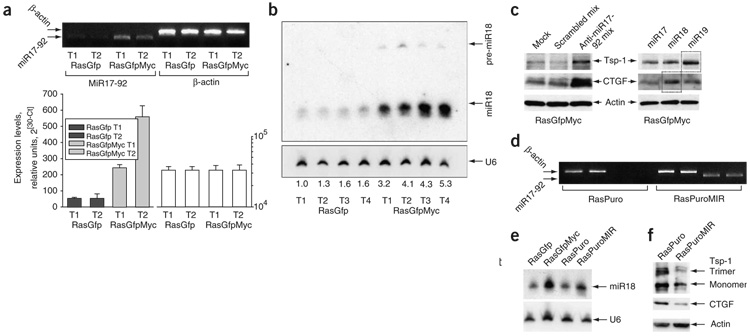
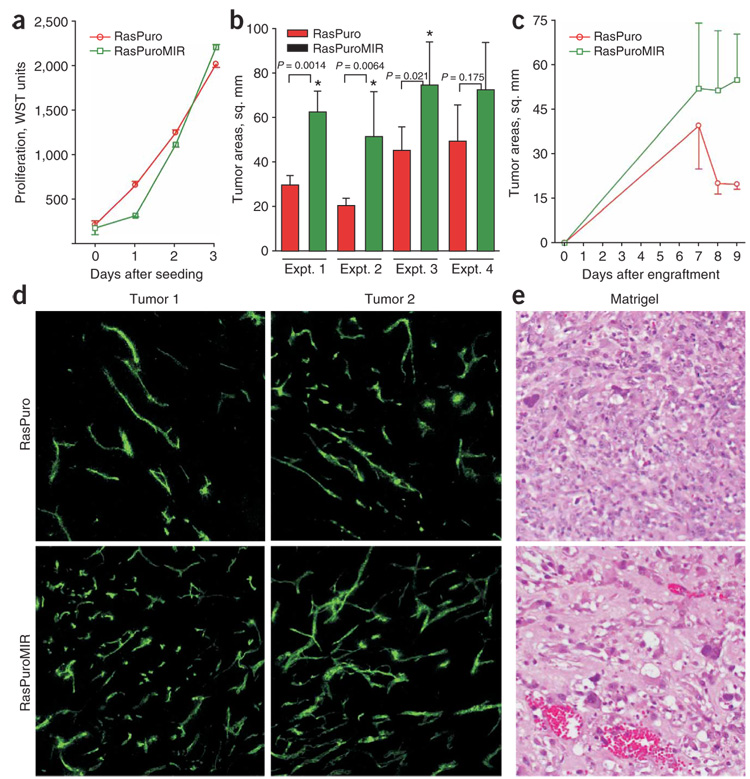
Human adenocarcinomas commonly harbor mutations in the KRAS and MYC proto-oncogenes and the TP53 tumor suppressor gene. All three genetic lesions are potentially pro-angiogenic, as they sustain production of vascular endothelial growth factor (VEGF). Yet Kras-transformed mouse colonocytes lacking p53 formed indolent, poorly vascularized tumors, whereas additional transduction with a Myc-encoding retrovirus promoted vigorous vascularization and growth. In addition, VEGF levels were unaffected by Myc, but enhanced neovascularization correlated with downregulation of anti-angiogenic thrombospondin-1 (Tsp1) and related proteins, such as connective tissue growth factor (CTGF). Both Tsp1 and CTGF are predicted targets for repression by the miR-17-92 microRNA cluster, which was upregulated in colonocytes coexpressing K-Ras and c-Myc. Indeed, miR-17-92 knockdown with antisense 2'-O-methyl oligoribonucleotides partly restored Tsp1 and CTGF expression; in addition, transduction of Ras-only cells with a miR-17-92-encoding retrovirus reduced Tsp1 and CTGF levels. Notably, miR-17-92-transduced cells formed larger, better-perfused tumors. These findings establish a role for microRNAs in non-cell-autonomous Myc-induced tumor phenotypes.


Figures

Figure 1
Figure 1. Growth properties of RasGfp versus RasGfpMyc p53-null colonocytes in vivo and in vitro
(a) Cell accumulation assay performed on RasGfp and RasGfpMyc colonocytes. We assessed the number of viable cells in triplicate plates using the WST reagent. We assessed levels of Myc overexpression by immunoblotting (inset) using mouse β-actin as a loading control. (b) Average weights of subcutaneous tumors formed by RasGfp (bars 1, 3, 4), RasGfpMyc (bar 2) and RasGfpMycER (bars 5, 6) colonocytes. Where indicated, tumor-bearing animals were treated with 4OHT (‘with 4OHT’) or left untreated (‘w/o 4OHT’). Error bars in a and b refer to s.d. (c) Comparative analysis of RasGfp and RasGfp Myc tumors. Left: hematoxylin and eosin staining (H&E). Perfused blood vessels contain numerous red blood cells. Center: staining of endothelial cells with lectin (brown). Right: staining of lymphatic vessels with an antibody against LYVE-1 (brown). A large vessel in the RasGfpMyc LYVE-1 image localizes in the surrounding adipose tissue. The inset depicts staining of normal ileum.
Figure 2
Figure 2. Expression of pro- and anti-angiogenic factors in RasGfp and RasGfpMyc carcinomas
(a) Lack of detectable HIF1α in RasGfp and RasGfpMyc tumor lysates. Two independent tumors of each type (T1 and T2) were assayed. Mouse ES cells cultured in the presence or absence of hypoxia mimetic desferrioxamine (DFX) were used for comparison. (b) ELISA-based quantification of VEGF A in the same neoplasms. (c) Real-time RT-PCR analysis of thrombospondin-1 (thbs1) and CTGF gene expression in the same neoplasms. Error bars refer to s.d. (d) Immunoblotting analysis of Tsp1 and CTGF expression levels. For CTGF detection, cultured cells were used. (e) Immunoblotting analysis of CTGF expression levels in mass cultures of RasGfpMycER cells treated with 4OHT for indicated number of hours. We analyzed both whole-cell lysates and conditioned medium. RasGfp and RasGfpMyc cells were used for comparison. (f) The same analysis performed on three single-cell RasGfpMycER clones. When we analyzed conditioned medium, we normalized TSR protein levels to cell numbers. (g) Immunoblotting analysis of Tsp1 and CTGF expression levels in RasGfpMycER clone 3. Assayed cells were initially treated with 4OHT for 72 h (left) and then deprived of 4OHT for additional 72 h (right). Trimeric form of Tsp1 was predominantly expressed in these lysates.
Figure 3
Figure 3. miR-17-92 and TSR protein expression in RasGfp and RasGfpMyc cells
(a) Real-time RT-PCR analysis of the miR-17-92 primary transcript. We tested the same tumors here as in Figure 2. Upper part of panel depicts PCR products quantified in the bar graphs below. Error bars refer to s.d. (b) RNA blot analysis of four RasGfp and four RasGfpMyc tumors. The miR-18 probe detects both pre-miR-18 and mature miR-18 species. U6 RNA was used as a loading control. Numbers below the autoradiogram refer to the increase in miR-18 levels as a multiple of that in RasGfp T1. (c) Immunoblotting analysis of Tsp1 and CTGF expression levels in RasGfpMyc cells transfected with antisense 2′-O-methyl oligoribonucleotides targeting components of the miR-17-92 cluster. Left: cells transfected with mixtures of scrambled or miR-17-92-specific oligoribonucleotides. Mock-transfected cells were used as an additional control. Right: the same cells transfected with oligoribonucleotides targeting individual microRNAs. (d) RT-PCR performed on Ras-only colonocytes transduced with either empty vector (RasPuro) or the miR-17-92–encoding retrovirus (RasPuroMIR). PCR primers were specific for the human miR-17-92 pre-miRNA and did not detect the endogenous mouse transcript. (e) RNA blot analysis of the same cells. RasGfp and RasGfpMyc cells were used for comparison. Other designations are as in b. (f) Immunoblotting analysis of Tsp1 and CTGF expression levels in RasPuro versus RasPuroMIR cells.
Figure 4
Figure 4. The effects of miR-17-92 upregulation in Ras-only cells on neoplastic growth
(a) Cell accumulation assay performed on RasPuro and RasPuroMIR colonocytes. Numbers of viable cells were assessed using the WST reagent as in Figure 1a. (b) Average sizes of subcutaneous tumors formed by RasPuro and RasPuroMIR colonocytes in syngeneic mice. * indicates statistical significance (P < 0.05). P values were determined using unpaired Student’s t-test. (c) Kinetics of tumor formation by RasPuro and RasPuroMIR colonocytes from experiment 2 in b. Error bars in a–c represent s.d. (d) Blood perfusion of RasPuro and RasPuroMIR tumors. Green staining corresponds to FITC-conjugated lectin bound to vascular endothelial cells after intravenous injection. Two independent tumors were assayed. Representative 10× sections from each neoplasm are shown. (e) Matrigel neovascularization induced by the same cells. The richly perfused, large-caliber vascular channels in the lower image are typical of RasPuroMIR samples.

References

    1. Pelengaris S, Littlewood T, Khan M, Elia G, Evan GI. Reversible activation of c-Myc in skin: induction of a complex neoplastic phenotype by a single oncogenic lesion. Mol. Cell. 1999;3:565–577. - PubMed
    1. Brandvold KA, Neiman P, Ruddell A. Angiogenesis is an early event in the generation of myc-induced lymphomas. Oncogene. 2000;19:2780–2785. - PubMed
    1. Ngo C, et al. An in vivo function for the transforming myc protein: elicitation of the angiogenic phenotype. Cell Growth Differ. 2000;11:201–210. - PMC - PubMed
    1. Baudino TA, et al. c-Myc is essential for vasculogenesis and angiogenesis during development and tumor progression. Genes Dev. 2002;16:2530–2543. - PMC - PubMed
    1. Ruddell A, Mezquita P, Brandvold KA, Farr A, Iritani BM. B lymphocyte-specific c-Myc expression stimulates early and functional expansion of the vasculature and lymphatics during lymphomagenesis. Am. J. Pathol. 2003;163:2233–2245. - PMC - PubMed

Publication types

MeSH terms