. 2006 Aug;128(2):171-84.
doi: 10.1085/jgp.200609555.

Fast adaptation in mouse olfactory sensory neurons does not require the activity of phosphodiesterase

Affiliations

Fast adaptation in mouse olfactory sensory neurons does not require the activity of phosphodiesterase

Anna Boccaccio et al. J Gen Physiol. 2006 Aug.

Abstract

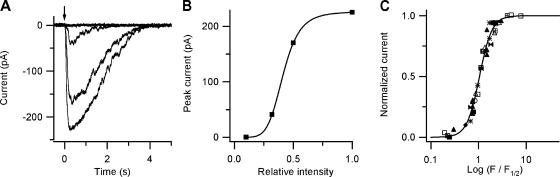
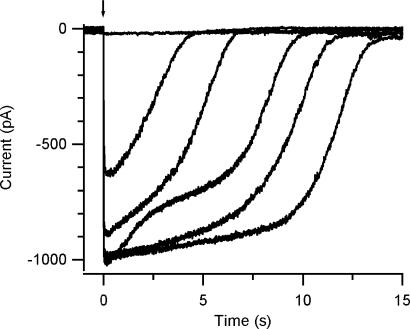
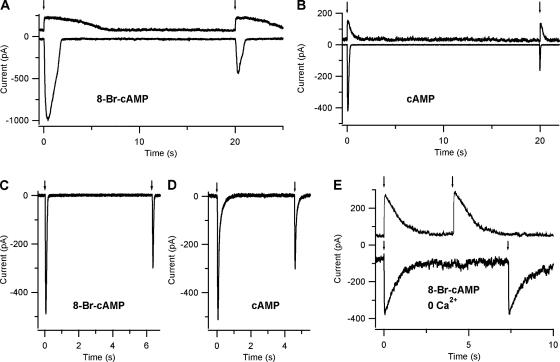
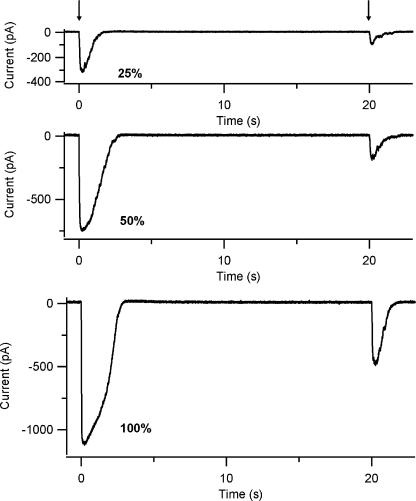
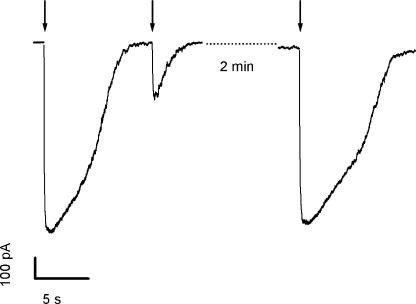
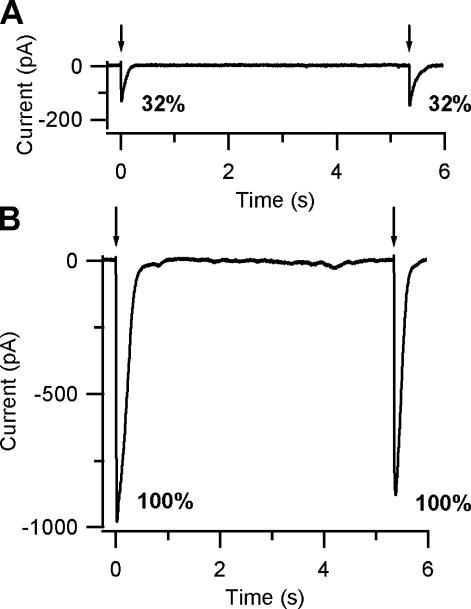
Vertebrate olfactory sensory neurons rapidly adapt to repetitive odorant stimuli. Previous studies have shown that the principal molecular mechanisms for odorant adaptation take place after the odorant-induced production of cAMP, and that one important mechanism is the negative feedback modulation by Ca2+-calmodulin (Ca2+-CaM) of the cyclic nucleotide-gated (CNG) channel. However, the physiological role of the Ca2+-dependent activity of phosphodiesterase (PDE) in adaptation has not been investigated yet. We used the whole-cell voltage-clamp technique to record currents in mouse olfactory sensory neurons elicited by photorelease of 8-Br-cAMP, an analogue of cAMP commonly used as a hydrolysis-resistant compound and known to be a potent agonist of the olfactory CNG channel. We measured currents in response to repetitive photoreleases of cAMP or of 8-Br-cAMP and we observed similar adaptation in response to the second stimulus. Control experiments were conducted in the presence of the PDE inhibitor IBMX, confirming that an increase in PDE activity was not involved in the response decrease. Since the total current activated by 8-Br-cAMP, as well as that physiologically induced by odorants, is composed not only of current carried by Na+ and Ca2+ through CNG channels, but also by a Ca2+-activated Cl- current, we performed control experiments in which the reversal potential of Cl- was set, by ion substitution, at the same value of the holding potential, -50 mV. Adaptation was measured also in these conditions of diminished Ca2+-activated Cl- current. Furthermore, by producing repetitive increases of ciliary's Ca2+ with flash photolysis of caged Ca2+, we showed that Ca2+-activated Cl- channels do not adapt and that there is no Cl- depletion in the cilia. All together, these results indicate that the activity of ciliary PDE is not required for fast adaptation to repetitive stimuli in mouse olfactory sensory neurons.


Figures

Figure 1.
Figure 1.
Current responses induced by photorelease of 8-Br-cAMP as a function of flash intensity. (A) 50 μM caged 8-Br-cAMP diffused into the cell from the patch pipette and flashes of increasing intensity and identical duration were applied to the ciliary region. The arrow indicates the time of application of light flashes of various relative intensities: 0.1, 0.32, 0.5, and 1. Whole-cell current responses were measured at the holding potential of −50 mV. (B) Peak currents from the cell in A were plotted as a function of the relative light intensity, F. The continuous line was the best fit of the Hill Eq. 1 to the data with the following values: Imax = 226 pA, F1/2 = 0.41, and n = 5.4. (C) Collected results from nine different olfactory sensory neurons. Each symbol represents a different cell. Both axes are normalized values. Normalized peak currents in each cell (I/Imax) were plotted versus the logarithm of the relative intensity normalized to the F1/2 value (F/F1/2) for each cell. The continuous line was the best fit of Eq. 1 to the collected data with n = 3.3. Values of F1/2 ranged from 0.10 to 0.47, n from 3 to 5.4, and Imax from −160 to −1200 pA.
Figure 2.
Figure 2.
Estimation of the photoreleased concentration of 8-Br-cAMP. (A–C) Current responses in 0 Ca2+ Ringer solution (with 10 mM EGTA) induced by photorelease of 8-Br-cAMP as a function of flash intensity at −50 mV. In the absence of Ca2+ entry, the current was entirely due to CNG channels. (D–F) Ca2+ entry was also reduced by recording at +50 mV in Ringer solution. (A and D) Arrows indicate the time of application of light flashes of various relative intensities: 0.01, 0.1, 0.32, and 0.8 in A and 0.25, 0.4, 0.8, and 1 in D in two different neurons. Peak currents from the experiments in A and D were plotted as a function of the relative light intensity in B and E, respectively. The continuous line was the best fit of the Hill Eq. 1 to the data with the following values: (B) Imax = 1070 pA, F1/2 = 0.28, n = 1.8; (E) Imax = 653 pA, F1/2 = 0.34, n = 1.7. Collected results from data at −50 mV in 0 Ca2+ solution from three different olfactory sensory neurons (C), and from data at +50 mV in Ringer solution from two different olfactory sensory neurons (D). Each symbol represents a different cell. Both axes are normalized values. Normalized peak currents in each cell (I/Imax) were plotted versus the logarithm of the relative intensity normalized to the F1/2 value (F/F1/2) for each cell. The continuous line was the best fit of Eq. 1 to the collected data with n = 1.8 in C and 1.7 in F. The average value for n was 1.9 ± 0.4 (N = 3) at −50 mV and 0 Ca2+ solution, and 1.7 ± 0.1 (N = 2) at +50 mV in Ringer solution.
Figure 3.
Figure 3.
Kinetics of current recovery to baseline in 0 Ca2+ Ringer. Current responses induced by photorelease of 8-Br-cAMP as a function of flash intensity in 0 Ca2+ Ringer. Holding potential was −50 mV. Flashes of increasing relative intensities 0.01, 0.1, 0.32, 0.5, 0.8, 1 were applied to the ciliary region. In this neuron, the maximal current response, entirely due to activation of CNG channels, was already reached at 0.5 relative light intensity. Higher light intensities elicited the same peak current, but increased the time necessary for the current to return to baseline, probably due to the time employed by 8-Br-cAMP to diffuse away from the cilia. The increase in recovery time with higher light intensity indicates that although the CNG current was already fully activated, the intraciliary concentration of 8-Br-cAMP could be further increased, meaning that with a pipette concentration of 50 μM caged 8-Br-cAMP, the range of light intensity of our experimental system could fully activate the CNG channels.
Figure 4.
Figure 4.
Response adaptation to photorelease of cAMP or 8-Br-cAMP. Different olfactory sensory neurons were loaded with 50 μM caged 8-Br-cAMP (A, C, and E) or with 250 μM caged cAMP (B and D). A and B show current responses to repetitive light flashes of the same maximal intensity at interflash interval of 20 s in two neurons with similar adaptation properties. In each panel, recordings at +50 mV (top traces) and at −50 mV (bottom traces) were obtained from the same neuron. The two selected neurons showed similar adaptation in 8-Br-cAMP (A) and cAMP (B). At −50 mV, the peak amplitudes of the responses to the second flash (−403 pA, −160 pA) were 42% and 38% of the responses to the first flash (−951 pA, −421 pA) for 8-Br-cAMP (A) or cAMP (B), respectively. At +50 mV, the peak amplitudes of current responses to repetitive flashes were very similar, indicating the absence of adaptation. C and D show two neurons in which adaptation was measured at interflash intervals of 6.3 s (C) or 4.6 s (D). The two selected neurons showed similar adaptation in 8-Br-cAMP (C) and cAMP (D). At −50 mV, the peak amplitudes of the responses to the second flash (−298 pA, −302 pA) were 61% and 59% of the responses to the first flash (−488 pA, −511 pA) for 8-Br-cAMP (C) or cAMP (D), respectively. (E) Control experiment in a different neuron in nominally 0 Ca2+ Ringer solution, where the absence of Ca2+ entry prevented both adaptation and the activation of the Ca2+-activated Cl channel. Currents to repetitive flashes of the same maximal intensity photoreleasing 8-Br-cAMP reached a similar amplitude both at +50 mV (226 and 225 pA), and at −50 mV (−306 and −290 pA), indicating the photorelease of the same 8-Br-cAMP concentration. Control experiments in 0 Ca were obtained in a total of five neurons.
Figure 5.
Figure 5.
Response adaptation at different light intensities. Whole-cell currents induced by repetitive photorelease of 8-Br-cAMP in an olfactory sensory neuron held at −50 mV. The arrows indicate the timing of the light flashes at 0.25 (top trace), 0.5 (middle trace), and 1 (bottom trace) relative light intensities. Response adaptation was measured at interflash interval of 20 s. The peak amplitude of the adapted response was 31%, 22%, and 43% of the control response at 0.25, 0.5, and 1 relative light intensities, respectively.
Figure 6.
Figure 6.
Time course of recovery from adaptation. (A) Responses to photorelease of 8-Br-cAMP were obtained with two light flashes of the same intensity at various time intervals 2.5, 4, and 6.8 s in the same olfactory sensory neurons. Traces in A are shown superimposed in B. Arrows indicate the timing of the light flashes. The holding potential was −50 mV.
Figure 7.
Figure 7.
Shift of the dynamic range. Current responses induced by photolysis of caged 8-Br-cAMP in two olfactory sensory neurons. Currents were measured as a function of relative flash intensities in control and in adapted condition for the first (A–D) and the second (E–H) olfactory neuron, respectively. Relative flash intensities were 0.32, 0.50, and 1 in the first neuron (A and B), with Imax = −1150 pA, and 0.1, 0.5, 0.8, and 1 in the second neuron (E and F), with Imax = −340 pA. The superimposed current responses in the adapted state were obtained from the experiments illustrated in C and G: an adapting flash of maximal light intensity was applied to the neuron followed by a second flash after 19 s in C and 30 s in G. The intensity of the first flash was kept constant and the intensity of the second flash was varied as indicated in the figure. The holding potential was −50 mV. (D and H) Normalized peak currents were plotted versus relative flash intensity both for the control (filled squares) and for the adapted (open squares) state. Data were fitted by the Hill equation, Eq. 1, with F1/2 = 0.36 and n = 3.7 in the control, and with F1/2 = 0.85 and n = 5.5 in the adapted state for the first neuron (D), and with F1/2 = 0.11 and n = 3.2 in the control, and with F1/2 = 0.72 and n = 1.9 in the adapted state for the second neuron (H). Results showing a shift of the dynamic range in the adapted state toward higher light intensities compared with the control state were measured in three olfactory sensory neurons.
Figure 8.
Figure 8.
Response adaptation in the presence of the PDE inhibitor IBMX. Adaptation of the responses to photorelease of 8-Br-cAMP at −50 mV in presence of IBMX (300 μM) and MDL-12,330A (50 μM) in the bath. Interflash interval 10 s. The peak amplitude of the response to the second flash (−265 pA) was reduced to 29% of the response to the first flash (−914 pA). After 2 min, the response recovered to its initial value. Five olfactory sensory neurons were tested with repetitive flashes in the presence of IBMX and MDL-12,330A (two neurons) or SQ 22,536 (three neurons) and all showed adaptation.
Figure 9.
Figure 9.
Response adaptation of the cationic current component. The reversal potential of the Cl current was set at −50 mV, reducing the intracellular Cl concentration by partial replacement with gluconate. Responses to photorelease of 8-Br-cAMP by two light flashes of the same intensity, interflash interval 20 s. Currents in the same olfactory sensory neuron were measured at the holding potential of +50 mV (top trace) or −50 mV (bottom trace), corresponding to the calculated reversal potential for chloride. Current amplitudes at +50 mV were similar (80 and 81 pA), whereas at −50 mV, the response to the second flash (−8 pA) was reduced to 36% of the response to the first flash (−22 pA). The small size of the CNG-induced inward current is consistent with previous data showing that in the presence of 1 mM external Ca2+, the ratio between the CNG current at +50 and −50 mV was ∼4 (Fig. 1 of Kleene, 1995) and indicates that in mouse olfactory sensory neurons, high values of inward current are due to Ca2+-activated Cl current. Similar results were measured in a total of five olfactory sensory neurons.
Figure 10.
Figure 10.
Current responses induced by photorelease of Ca2+ as a function of flash intensity. (A) Caged Ca2+ (DMNP-EDTA) diffused into the cell from the patch pipette and flashes of increasing intensity were applied to the ciliary region. The arrow indicates the time of application of light flashes of various relative intensities: 0.01, 0.05, 0.16, and 1. Whole-cell current responses were measured at the holding potential of −50 mV. (B) Peak currents from the cell in A were plotted as a function of the relative light intensity, F. The continuous line was the best fit of the Hill Eq. 1 to the data with the following values: Imax = 1250 pA, F1/2 = 0.13, and n = 1.5. (C) Collected results from four different olfactory sensory neurons. Each symbol represents a different cell. Both axes are normalized values. Normalized peak currents in each cell (I/Imax) were plotted versus the logarithm of the relative intensity normalized to the F1/2 value (F/F1/2) for each cell. The continuous line was the best fit of Eq. 1 to the collected data with n = 1.6. F1/2 values ranged between 0.12 and 0.34 and n values varied from 1.4 to 2.1, with an average of 1.7 ± 0.3 (N = 4).
Figure 11.
Figure 11.
Responses to repetitive photorelease of Ca2+. Whole-cell currents induced by repetitive photorelease of Ca2+ (DMNP-EDTA) in an olfactory sensory neuron at −50 mV. The arrows indicate the timing of the light flashes at 0.32 (A) and 1 (B) relative light intensity. Currents elicited by the second flash were very similar to those induced by the first one, indicating the absence of adaptation (130 and 135 pA at 0.32 [A]; 970 and 870 pA at 1 relative light intensity [B]). Three olfactory sensory neurons showed a similar absence of current adaptation to the second photorelease of Ca2+.

Comment in

Similar articles

Cited by

References

    1. Balasubramanian, S., J.W. Lynch, and P.H. Barry. 1996. Calcium-dependent modulation of the agonist affinity of the mammalian olfactory cyclic nucleotide-gated channel by calmodulin and a novel endogenous factor. J. Membr. Biol. 152:13–23. - PubMed
    1. Beltman, J., D.E. Becker, E. Butt, G.S. Jensen, S.D. Rybalkin, B. Jastorff, and J.A. Beavo. 1995. Characterization of cyclic nucleotide phosphodiesterases with cyclic GMP analogs: topology of the catalytic domains. Mol. Pharmacol. 47:330–339. - PubMed
    1. Boekhoff, I., C. Kroner, and H. Breer. 1996. Calcium controls second-messenger signalling in olfactory cilia. Cell. Signal. 8:167–171. - PubMed
    1. Borisy, F.F., G.V. Ronnett, A.M. Cunningham, D. Juilfs, J. Beavo, and S.H. Snyder. 1992. Calcium/calmodulin-activated phosphodiesterase expressed in olfactory receptor neurons. J. Neurosci. 12:915–923. - PMC - PubMed
    1. Bradley, J., W. Bonigk, K.W. Yau, and S. Frings. 2004. Calmodulin permanently associates with rat olfactory CNG channels under native conditions. Nat. Neurosci. 7:705–710. - PMC - PubMed

Publication types

MeSH terms