Identifying transcription factor functions and targets by phenotypic activation
- PMID: 16880382
- PMCID: PMC1567694
- DOI: 10.1073/pnas.0605140103
Identifying transcription factor functions and targets by phenotypic activation
Abstract
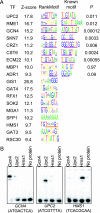
Mapping transcriptional regulatory networks is difficult because many transcription factors (TFs) are activated only under specific conditions. We describe a generic strategy for identifying genes and pathways induced by individual TFs that does not require knowledge of their normal activation cues. Microarray analysis of 55 yeast TFs that caused a growth phenotype when overexpressed showed that the majority caused increased transcript levels of genes in specific physiological categories, suggesting a mechanism for growth inhibition. Induced genes typically included established targets and genes with consensus promoter motifs, if known, indicating that these data are useful for identifying potential new target genes and binding sites. We identified the sequence 5'-TCACGCAA as a binding sequence for Hms1p, a TF that positively regulates pseudohyphal growth and previously had no known motif. The general strategy outlined here presents a straightforward approach to discovery of TF activities and mapping targets that could be adapted to any organism with transgenic technology.
Conflict of interest statement
Conflict of interest statement: No conflicts declared.
Figures


Similar articles
-
Identification of transcription factor targets by phenotypic activation and microarray expression profiling in yeast.Methods Mol Biol. 2009;548:19-35. doi: 10.1007/978-1-59745-540-4_2. Methods Mol Biol. 2009. PMID: 19521817
-
Graphical analysis and experimental evaluation of Saccharomyces cerevisiae PTRK1|2 and PBMH1|2 promoter region.Genome Inform. 2010 Jan;22:11-20. Genome Inform. 2010. PMID: 20238415
-
Computational identification of combinatorial regulation and transcription factor binding sites.Biotechnol Bioeng. 2007 Aug 15;97(6):1594-602. doi: 10.1002/bit.21354. Biotechnol Bioeng. 2007. PMID: 17252601
-
Transcriptional networks: reverse-engineering gene regulation on a global scale.Curr Opin Microbiol. 2004 Dec;7(6):638-46. doi: 10.1016/j.mib.2004.10.009. Curr Opin Microbiol. 2004. PMID: 15556037 Review.
-
Support of progress in clinical neurology by models of genetic regulation.Arch Neurol. 2003 Aug;60(8):1053-7. doi: 10.1001/archneur.60.8.1053. Arch Neurol. 2003. PMID: 12925359 Review.
Cited by
-
Mapping functional transcription factor networks from gene expression data.Genome Res. 2013 Aug;23(8):1319-28. doi: 10.1101/gr.150904.112. Epub 2013 May 1. Genome Res. 2013. PMID: 23636944 Free PMC article.
-
Inference of gene regulation functions from dynamic transcriptome data.Elife. 2016 Sep 21;5:e12188. doi: 10.7554/eLife.12188. Elife. 2016. PMID: 27652904 Free PMC article.
-
YEASTRACT-DISCOVERER: new tools to improve the analysis of transcriptional regulatory associations in Saccharomyces cerevisiae.Nucleic Acids Res. 2008 Jan;36(Database issue):D132-6. doi: 10.1093/nar/gkm976. Epub 2007 Nov 21. Nucleic Acids Res. 2008. PMID: 18032429 Free PMC article.
-
Anaphase promoting complex-dependent degradation of transcriptional repressors Nrm1 and Yhp1 in Saccharomyces cerevisiae.Mol Biol Cell. 2011 Jul 1;22(13):2175-84. doi: 10.1091/mbc.E11-01-0031. Epub 2011 May 11. Mol Biol Cell. 2011. PMID: 21562221 Free PMC article.
-
Identification of potential calorie restriction-mimicking yeast mutants with increased mitochondrial respiratory chain and nitric oxide levels.J Aging Res. 2011 Mar 31;2011:673185. doi: 10.4061/2011/673185. J Aging Res. 2011. PMID: 21584246 Free PMC article.
References
-
- Kellis M., Patterson N., Endrizzi M., Birren B., Lander E. S. Nature. 2003;423:241–254. - PubMed
-
- Cliften P., Sudarsanam P., Desikan A., Fulton L., Fulton B., Majors J., Waterston R., Cohen B. A., Johnston M. Science. 2003;301:71–76. - PubMed
-
- Gray P. A., Fu H., Luo P., Zhao Q., Yu J., Ferrari A., Tenzen T., Yuk D. I., Tsung E. F., Cai Z., et al. Science. 2004;306:2255–2257. - PubMed
Publication types
MeSH terms
Substances
LinkOut - more resources
Full Text Sources
Other Literature Sources
Molecular Biology Databases
Miscellaneous

