. 2006 Aug 8;103(32):12138-43.
doi: 10.1073/pnas.0604911103. Epub 2006 Jul 31.

Cellular scaling rules for rodent brains

Affiliations

Cellular scaling rules for rodent brains

Suzana Herculano-Houzel et al. Proc Natl Acad Sci U S A. .

Abstract

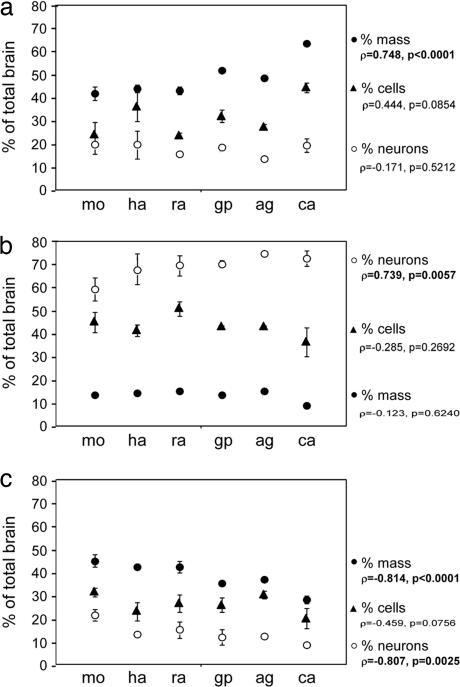
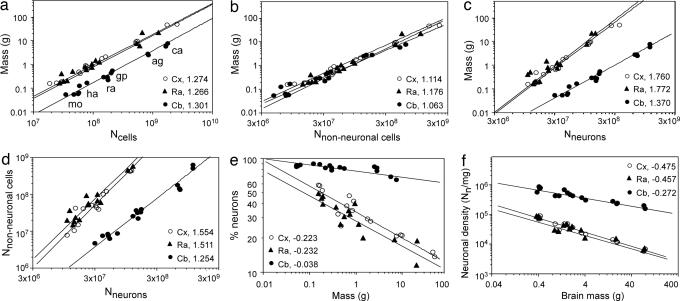
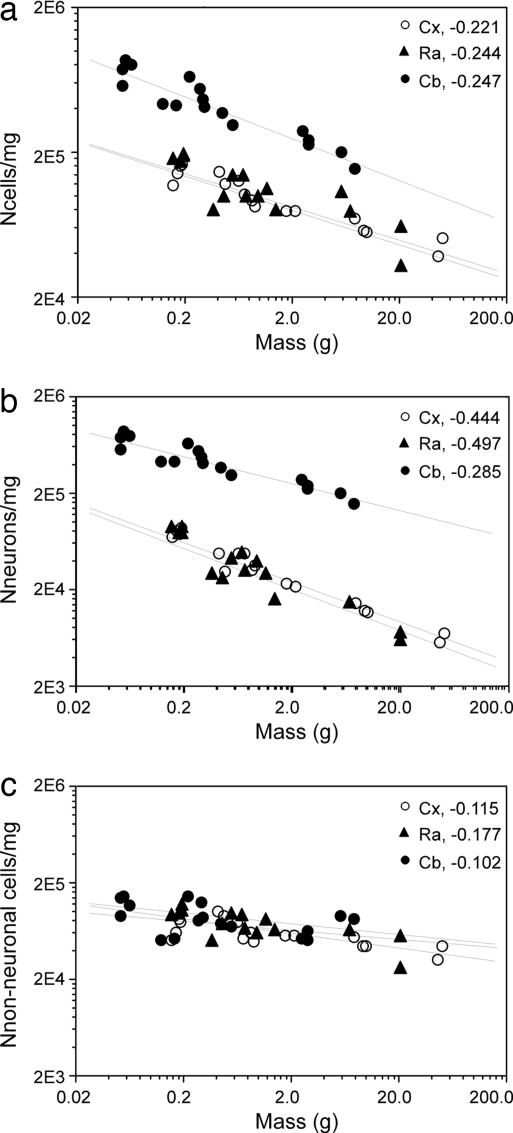
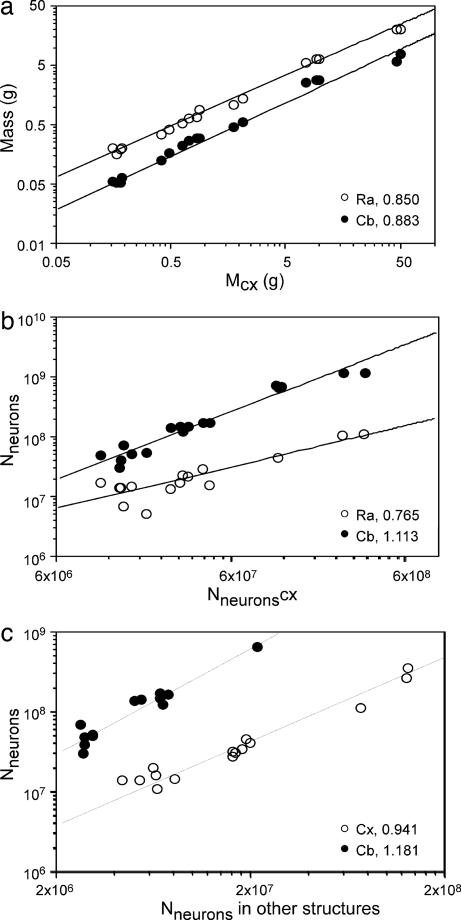
How do cell number and size determine brain size? Here, we show that, in the order Rodentia, increased size of the cerebral cortex, cerebellum, and remaining areas across six species is achieved through greater numbers of neurons of larger size, and much greater numbers of nonneuronal cells of roughly invariant size, such that the ratio between total neuronal and nonneuronal mass remains constant across species. Although relative cerebellar size remains stable among rodents, the number of cerebellar neurons increases with brain size more rapidly than in the cortex, such that the cerebellar fraction of total brain neurons increases with brain size. In contrast, although the relative cortical size increases with total brain size, the cortical fraction of total brain neurons remains constant. We propose that the faster increase in average neuronal size in the cerebral cortex than in the cerebellum as these structures gain neurons and the rapidly increasing glial numbers that generate glial mass to match total neuronal mass at a fixed glia/neuron total mass ratio are fundamental cellular constraints that lead to the relative expansion of cerebral cortical volume across species.


Conflict of interest statement

Conflict of interest statement: No conflicts declared.

Figures

Fig. 1.
Fig. 1.
Percent mass (filled circles), cells (filled triangles), and neurons (open circles) contained in the cerebral cortex (a), cerebellum (b), and remaining areas (c) relative to the whole brain in each species, arranged by increasing brain size. Bars indicate SD. Spearman correlation coefficients (ρ) and P values are indicated. mo, mouse; ha, hamster; ra, rat; gp, guinea pig; ag, agouti; ca, capybara.
Fig. 2.
Fig. 2.
Cellular scaling rules for rodent brains. Each point represents one individual. Species are as indicated in a. All graphs are fitted with power functions whose exponents are indicated. All P < 0.0001. (ac) Graphs show structure mass across species as a function of total number of cells (a), total number of nonneuronal cells (b), and total number of neurons (c). (d) Total number of nonneuronal cells as a function of total number of neurons in each structure across species. (e) Percentage of neurons relative to total number of cells in each structure as a function of total brain mass across species. (f) Neuronal density as a function of total brain mass for each structure, across species. Cx, cerebral cortex; Cb, cerebellum; Ra, remaining areas; mo, mouse; ha, hamster; ra, rat; gp, guinea pig; ag, agouti; ca, capybara.
Fig. 3.
Fig. 3.
Variation in total (a), neuronal (b), and nonneuronal (c) cell density in the cerebral cortex, cerebellum, and remaining areas as a function of structure mass. All graphs are fitted with power functions whose exponents are indicated. (a and b) All P < 0.0001. (c) P = 0.0009 (Cx and Cb); P = 0.0611 (Ra).
Fig. 4.
Fig. 4.
Variation in mass (a) and total number of neurons (b and c) of cerebellum and remaining areas as a function of these values in the cerebral cortex (a and b) and in the other structures (c). Power function exponents are indicated. P < 0.0001 (a) and P = 0.0005 (b and c). Notice that, although cerebellar mass increases at a smaller rate than cerebral cortical mass, the total number of cerebellar neurons grows more rapidly than that in the cerebral cortex.

References

    1. Stolzenburg J. U., Reichenbach A, Neumann M. Glia. 1989;2:78–84. - PubMed
    1. Tower D. B. J. Comp. Neurol. 1954;101:19–51. - PubMed
    1. Williams R. W., Herrup K. Annu. Rev. Neurosci. 1988;11:423–453. - PubMed
    1. Doetsch F. Nat. Neurosci. 2003;6:1127–1134. - PubMed
    1. Nishiyama A., Yang Z., Butt A. J. Anat. 2005;207:687–693. - PMC - PubMed

Publication types

LinkOut - more resources