. 2006 Aug 8;103(32):11916-21.
doi: 10.1073/pnas.0601597103. Epub 2006 Jul 31.

Ensemble molecular dynamics yields submillisecond kinetics and intermediates of membrane fusion

Affiliations

Ensemble molecular dynamics yields submillisecond kinetics and intermediates of membrane fusion

Peter M Kasson et al. Proc Natl Acad Sci U S A. .

Abstract

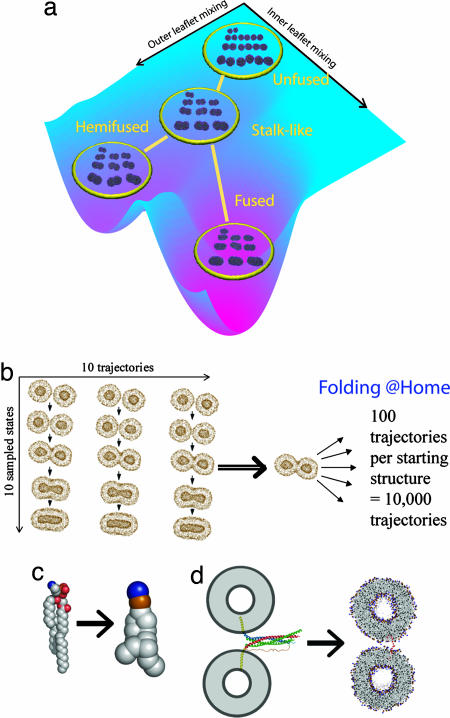
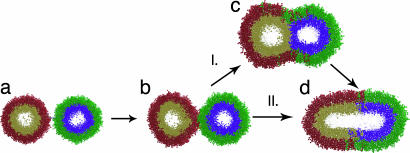
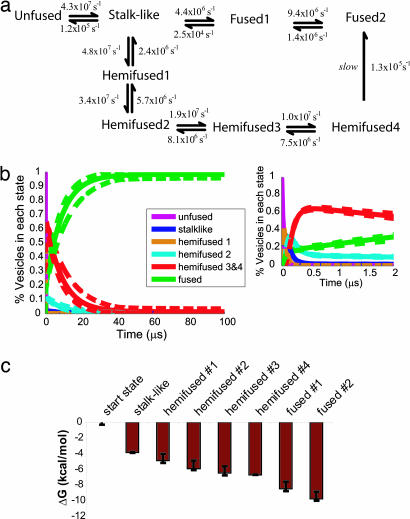
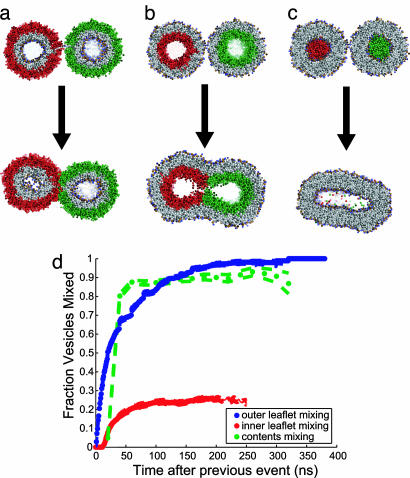
Lipid membrane fusion is critical to cellular transport and signaling processes such as constitutive secretion, neurotransmitter release, and infection by enveloped viruses. Here, we introduce a powerful computational methodology for simulating membrane fusion from a starting configuration designed to approximate activated prefusion assemblies from neuronal and viral fusion, producing results on a time scale and degree of mechanistic detail not previously possible to our knowledge. We use an approach to the long time scale simulation of fusion by constructing a Markovian state model with large-scale distributed computing, yielding an understanding of fusion mechanisms on time scales previously impossible to simulate to our knowledge. Our simulation data suggest a branched pathway for fusion, in which a common stalk-like intermediate can either rapidly form a fusion pore or remain in a metastable hemifused state that slowly forms fully fused vesicles. This branched reaction pathway provides a mechanistic explanation both for the biphasic fusion kinetics and the stable hemifused intermediates previously observed experimentally. Our distributed computing and Markovian state model approaches provide sufficient sampling to detect rare transitions, a systematic process for analyzing reaction pathways, and the ability to develop quantitative approximations of reaction kinetics for fusion.


Conflict of interest statement

Conflict of interest statement: No conflicts declared.

Figures

Fig. 1.
Fig. 1.
Methodological advances for the simulation of vesicle fusion. (a) The clustering of reaction snapshots into states and the linking of these clusters using MSM to derive a kinetic model for fusion reactions over long time scales. Ten randomly selected structures are rendered for each state, with lines representing transitions between states. The state-transition rendering is generated from the equilibrium distribution of states and overlaid on a surface schematizing the free energy landscape for fusion projected onto outer- and inner-leaflet lipid mixing reaction coordinates. (b) The ensemble-simulation scheme that we use with the Folding@Home distributed computing system. (c) A single POPE lipid using a unified-atom and a coarse-grained model (10, 11). (d) The analogy by which a chemical crosslinker is used to model a fusion protein such as the trans-SNARE complex, which is rendered based on an extrapolation from the crystal structure (35).
Fig. 2.
Fig. 2.
Branching reaction pathway for vesicle fusion. Pathway I shows the canonical progression from an unfused starting state (a) through a stalk-like early intermediate (b) and a hemifused late intermediate (c) to the fully fused state (d). Pathway II shows the additional reaction pathway observed in our simulations: rapid fusion from the stalk-like intermediate to the fully fused state. All renderings are of snapshots from observed reaction trajectories; lipids are colored to distinguish the outer (red and green) and inner (gold and blue) leaflets of each vesicle. Explicit water is present in all simulations but not rendered.
Fig. 3.
Fig. 3.
Vesicle fusion reaction mechanism and kinetics. (a) A schematic of the fusion reaction mechanism as determined by MSM. All reactions with probabilities >5% are shown with rates as calculated from the MSM transition matrix. In our simulations, fusion proceeds via a stalk-like intermediate state. We also observe a long-lived off-pathway intermediate that is hemifused, which slowly converts to the fused state (dashed line). Error estimation for calculated rates is given in Table 2, which is published as supporting information on the PNAS web site. (b) The reaction kinetics for fusion over multimillisecond time scales as determined from our simulations. The hemifused intermediate state dominates on the microsecond time scale, with a decay t1/2 of 6.3 μs. On the 10-μs time scale, the fused state dominates. (Inset) The formation of transient intermediates at early times. Dashed lines show 90% confidence bounds. (c) Free energy values calculated from the long-time scale kinetic model for each state identified via k-means clustering. Error bars denote 90% confidence intervals.
Fig. 4.
Fig. 4.
Measuring the progress of fusion via analogue to experiment. Progress of the vesicle fusion reaction is assessed via lipid and vesicle contents mixing, as have been measured in experimental assays (23, 28, 29). (a) Mixing of outer leaflet lipids. (b) Mixing of inner leaflet lipids. (c) Mixing of vesicle contents. (d) The fraction of vesicles that have mixed inner leaflet lipids, outer leaflet lipids, and contents, measured for each mixing event as a function of Δt from the time of the previous mixing event. Outer leaflet mixing is rapid and complete, but on the time scale of individual trajectories, only 26% of inner leaflets fuse; the remaining vesicles fuse at a much slower rate, dependent on the decay of off-pathway intermediates. Upon inner leaflet fusion, formation of a fusion pore and contents mixing is again rapid and complete. Dashed lines represent one standard deviation of the mean. Intravasicle lipid mixing between leaflets was observed in <2% of trajectory snapshops (Fig. 13, which is published as supporting information on the PNAS web site).
Fig. 5.
Fig. 5.
Dependence of vesicle fusion rates on crosslinker length. To assess the effect of crosslinker length on vesicle fusion rates, the fraction of vesicles that have mixed outer leaflets is plotted as a function of time for crosslinker lengths of 1, 2, 4, and 6 nm. Simulations with a crosslinker length of 2 nm have a t1/2 of 80 ns for outer leaflet mixing, compared with 20 ns for simulations with a 1-nm crosslinker. Simulations with crosslinker lengths of 4 and 6 nm remain at <50% fused after 150 ns. Dashed lines represent one standard deviation of the mean.

References

    1. Jahn R., Lang T., Sudhof T. C. Cell. 2003;112:519–533. - PubMed
    1. Skehel J. J., Wiley D. C. Annu. Rev. Biochem. 2000;69:531–569. - PubMed
    1. Chen Y. A., Scheller R. H. Nat. Rev. Mol. Cell Biol. 2001;2:98–106. - PubMed
    1. Bentz J. Biophys. J. 2000;78:227–245. - PMC - PubMed
    1. Marrink S. J., Mark A. E. J. Am. Chem. Soc. 2003;125:11144–11145. - PubMed

Publication types

LinkOut - more resources