. 2006 Aug;26(16):6005-15.
doi: 10.1128/MCB.02067-05.

Negative regulation of interleukin-2 and p38 mitogen-activated protein kinase during T-cell activation by the adaptor ALX

Affiliations

Negative regulation of interleukin-2 and p38 mitogen-activated protein kinase during T-cell activation by the adaptor ALX

Claire E Perchonock et al. Mol Cell Biol. 2006 Aug.

Abstract

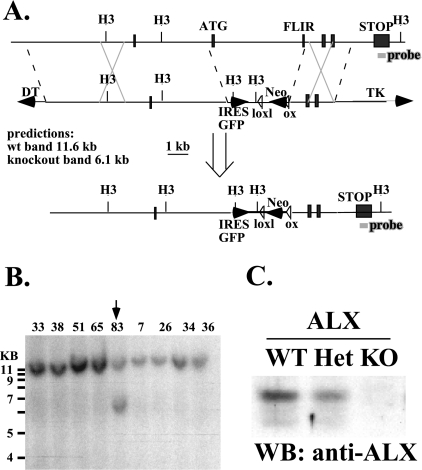
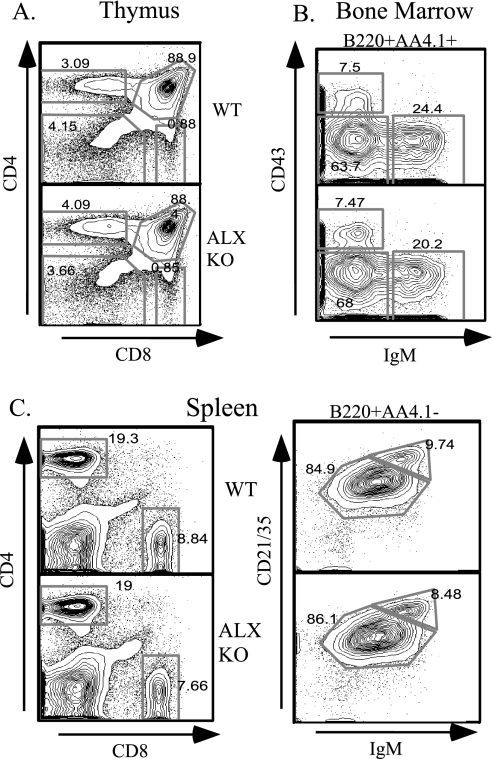
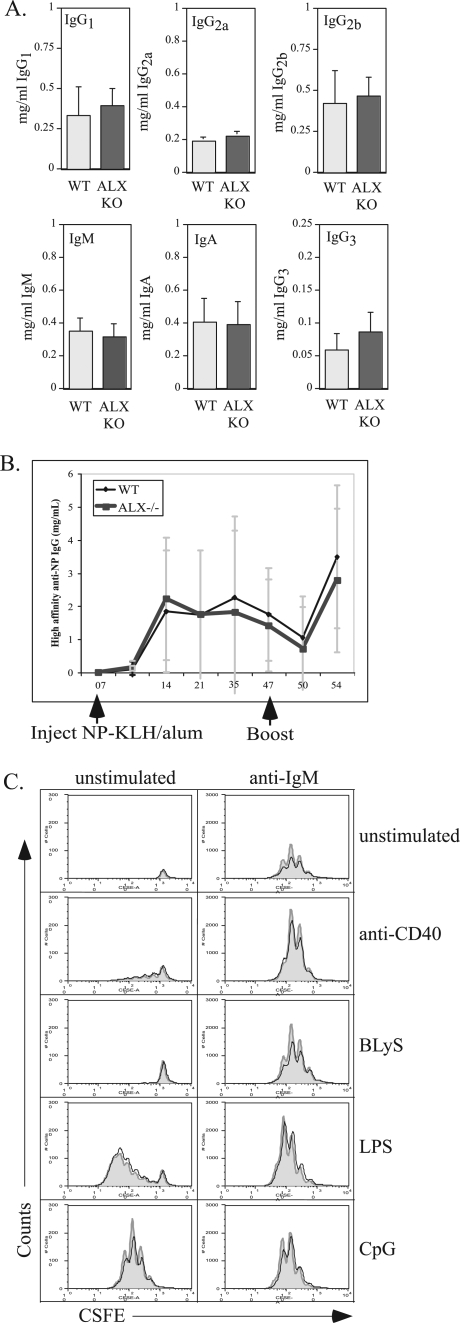
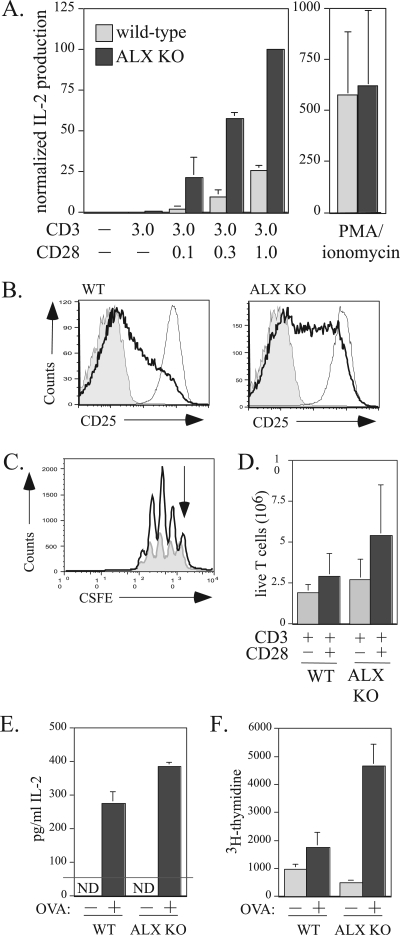
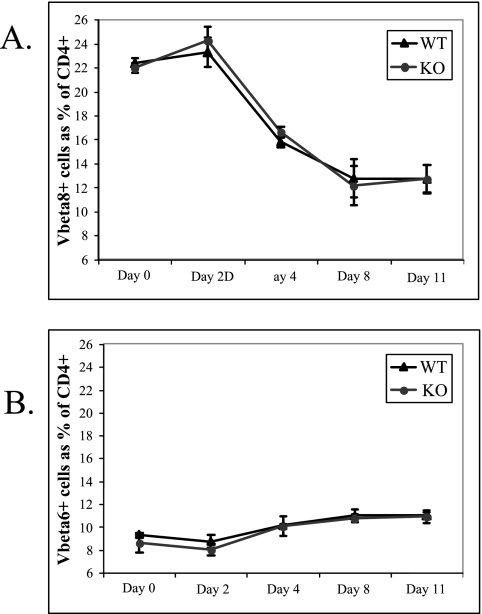
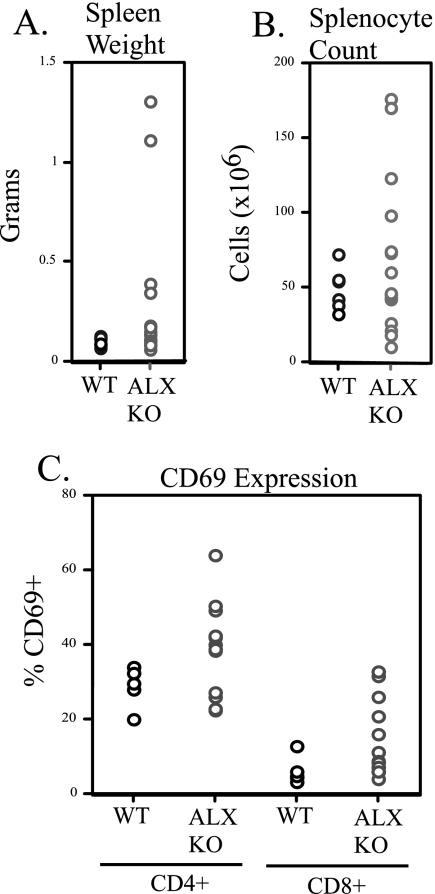
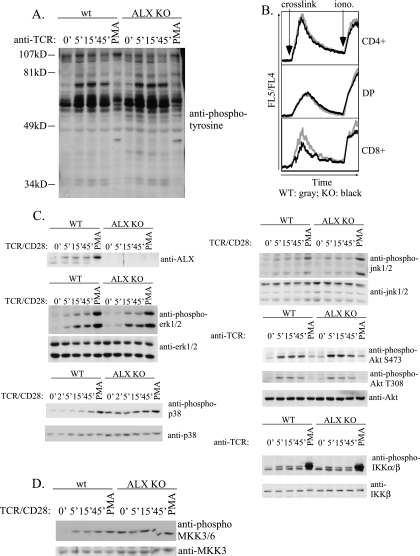
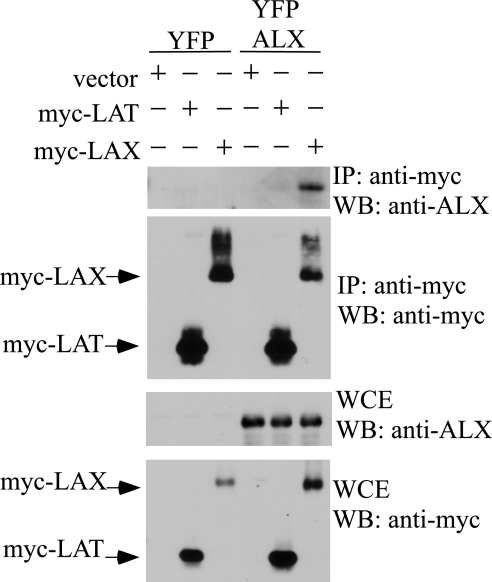
Activation of naïve T cells requires synergistic signals produced by the T-cell receptor (TCR) and by CD28. We previously identified the novel adaptor ALX, which, upon overexpression in Jurkat T cells, inhibited activation of the interleukin-2 (IL-2) promoter by TCR/CD28, suggesting that it is a negative regulator of T-cell activation. To further understand the physiological role of ALX, ALX-deficient mice were generated. Purified T cells from ALX-deficient mice demonstrated increased IL-2 production, CD25 expression, and proliferation in response to TCR/CD28 stimulation. Enhanced IL-2 production and proliferation were also observed when ALX-deficient mice were primed in vivo with ovalbumin-complete Freund's adjuvant and then restimulated ex vivo. Consistent with our initial overexpression studies, these data demonstrate that ALX is a negative regulator of T-cell activation. While TCR/CD28-mediated activations of phosphotyrosine induction, extracellular signal-regulated kinase 1/2, Jun N-terminal protein kinase, IkappaB kinase alpha/beta, and Akt were unaltered, constitutive activation of p38 mitogen-activated protein kinase and its upstream regulators MKK3/6 were observed for ALX-deficient splenocytes. The phenotype of ALX-deficient mice resembled the phenotype of those deficient in the transmembrane adaptor LAX, and an association between ALX and LAX proteins was demonstrated. These results suggest that ALX, in association with LAX, negatively regulates T-cell activation through inhibition of p38.


Figures

FIG. 1.
FIG. 1.
Generation of ALX-deficient mice via homologous recombination. (A) Schematic of the targeting construct designed to delete exons 2 and 3 via homologous recombination. H3, HindIII; TK, herpes simplex virus thymidine kinase; wt, wild type; IRES, internal ribosome entry site; GFP, green fluorescent protein; DT, diphtheria toxin. (B) Southern blot depicting targeted ES cell clones digested with HindIII and detected with a probe from the last exon of ALX, which is outside of the targeting construct (shown in panel A). All clones had the expected endogenous band (11.6 kb), while clone #83 also possessed a targeted allele (6.1 kb). (C) Western blot (WB) of wild-type (WT), heterozygous (Het), and ALX-deficient (KO) splenocytes probed for expression of ALX protein. Each lane contained lysates from the same number of cell equivalents.
FIG. 2.
FIG. 2.
Unimpaired lymphocyte development in ALX-deficient mice. Wild-type (WT) and ALX-deficient (ALX KO) littermates were analyzed at 8 weeks of age for developmental defects in T- and B-cell development by FACS analysis. (A) CD4 CD8, CD4+ CD8+, CD4+, and CD8+ thymocyte populations were similar between wild-type and ALX-deficient mice. (B) Developing B cells in the bone marrow were gated for B220+ AA4.1+ (to exclude recirculating mature B cells) and further subdivided into pro-B-cell (CD43+ IgM), pre-B-cell (CD43 IgM), and immature B-cell (CD43 IgM+) populations. No differences were observed for any of these populations, demonstrating that B-cell development proceeds normally in ALX-deficient mice. (C) Splenocytes stained with CD4 and CD8 revealed no differences in the proportions of CD4 and CD8 T cells in the periphery. To analyze mature B-cell populations, splenocytes were first gated for B220+ AA4.1 (to exclude transitional cells) and further subdivided into IgM+ CD21/35+ follicular B cells and IgMhigh CD21/35high marginal-zone B cells. Again, no differences in the mature B-cell populations in terms of number or proportion were observed for ALX-deficient mice.
FIG. 3.
FIG. 3.
Intact T-cell-dependent B-cell responses to antigen in vivo. (A) Serum immunoglobulin levels from wild-type and ALX-deficient mice were analyzed by ELISA. The data represent averages for six wild-type and nine ALX-deficient mice between 12 and 15 weeks of age. The error bars reflect the standard deviations within each group. (B) Five wild-type and four ALX-deficient mice between 9 and 10 weeks of age were immunized with 100 μg alum-precipitated NP-KLH/mouse on day 0, boosted on day 47, and sacrificed on day 54. Sera were collected at the time points shown and were assayed for the concentration of high affinity anti-NP IgG compared to that of the NP-specific IgG1 monoclonal antibody B1-8 used as a standard. The points represent the average concentrations for all wild-type mice or ALX-deficient mice. Error bars reflect the standard deviations within each genotype. (C) Purified B cells from wild-type and ALX-deficient mice were labeled with CSFE and either were left unstimulated or were stimulated with a combination of anti-IgM, anti-CD40, BLyS, CpG, and/or LPS as shown in the figure and as described in Materials and Methods. After 3 days, the cells were analyzed by FACS. TOPRO-3 (100 nM) was added to exclude dead cells from further analysis. A fixed number of 6-μm beads were added to each sample to permit calculation of the absolute number of live cells within each sample. The y axis represents absolute numbers of live B cells. For each stimulation condition, the gray-filled histograms represent wild-type B cells and the solid black lines represent ALX-deficient B cells. The results shown are representative of three separate experiments. WT, wild type; ALX KO, ALX deficient.
FIG. 4.
FIG. 4.
Increased IL-2 production and T-cell proliferation in ALX-deficient mice. (A) Purified T cells from wild-type and ALX-deficient mice were stimulated with 3 μg/ml plate bound anti-CD3 alone, with 0, 0.1, 0.3, or 1 μg/ml anti-CD28 in solution, or with 50 ng/ml PMA and 1 μM ionomycin as indicated in the figure. Culture supernatants were collected after 48 h and examined for IL-2 production by ELISA. The results shown are averages from three wild-type and three ALX-deficient mice and are normalized to the amount of IL-2 produced by ALX-deficient T cells stimulated with plate-bound anti-CD3 and anti-CD28. Error bars show the standard deviations. (B) Purified T cells from wild-type and ALX-deficient mice either were left unstimulated (shaded area), were stimulated for 48 h with 3 μg/ml plate-bound anti-CD3 with 0.3 μg/ml anti-CD28 in solution (darker line), or were stimulated with 50 ng/ml PMA and 1 μM ionomycin (lighter line) as for panel A and examined for expression of CD25 by FACS. Shown are representative data from four separate experiments. (C) Purified T cells from wild-type (shaded gray) and ALX-deficient (darker line) mice were CFSE labeled and stimulated with plate-bound anti-CD3 with or without anti-CD28. After 3 days, the cells were harvested. TOPRO-3 (100 nM) was added to exclude dead cells from further analysis, along with CD4-PE to analyze proliferation within the T-cell population. A fixed number of 6-μm beads were added to each sample to permit calculation of the absolute number of live cells within each sample. The y axis represents absolute numbers of live T cells. The arrow indicates the undivided peak. (D) Quantification of the absolute number of live T cells recovered from four sets of CSFE experiments with wild-type and ALX-deficient purified T cells as described for panel C. Error bars reflect the standard deviations for four mice within each group. (E) Ex vivo hyperresponsiveness to antigen in ALX-deficient mice. Three wild-type and three ALX-deficient mice were immunized with 100 μg of OVA plus complete Freund's adjuvant. After 2 weeks, splenocytes of the same genotype were pooled and cultured ex vivo with 10 μg/ml OVA. Cells restimulated for 48 h were given 1μCi/well [3H]thymidine for an additional 24 h. The supernatant was assessed for IL-2 production by ELISA at 48 hours after OVA restimulation. The standard deviations reflect triplicate ELISA wells. ND, not detected. (F) Results of [3H]thymidine incorporation at 72 h. The standard deviations reflect six wells per condition. WT, wild type; ALX KO, ALX deficient.
FIG. 5.
FIG. 5.
Unaffected Vβ8+ T-cell deletion in response to SEB immunization. (A) Three wild-type and three ALX-deficient littermates were injected intraperitoneally with 50 μg SEB in 200 μl PBS. At the various time points postinjection shown in the figure, blood was collected and examined by flow cytometry to determine the relative representations of Vβ8+ T cells (A) and Vβ6+ T cells (B), expressed as a percentage of total CD4+ cells. The black triangles represent the average of each population from three wild-type mice at each time point, while the gray circles represent the average of each population from ALX-deficient mice. Error bars reflect the standard deviations. WT, wild type; KO, ALX deficient.
FIG. 6.
FIG. 6.
Aged ALX-deficient mice show enhanced splenic size and T-cell activation. Six wild-type and 15 ALX-deficient F1 129/B6 mice were allowed to reach ages of 15 to 16 months, and then they were examined for abnormalities in peripheral lymphoid organs and pathology. (A) Spleens were isolated from each animal and their weights were recorded. Shown is a scatterplot for all mice demonstrating that while older wild-type mice had normal spleen weights of approximately 0.1 g, significant variation in spleen size was observed in older ALX-deficient animals. (B) The spleens whose weights are shown in panel A were examined for total cellularity. Data are shown as a scatterplot with each point representing cellularity in millions of cells. (C) Splenocyte suspensions from older animals were stained with various cell surface molecules to examine the activation status (by CD69 expression) on CD4+ and CD8+ T cells by flow cytometry. Shown is the percentage of CD69+ cells from each animal in a scatterplot within either the CD4+ or CD8+ populations. WT, wild type; KO, ALX deficient.
FIG. 7.
FIG. 7.
Analysis of T-cell signaling in primary wild-type and ALX-deficient splenocytes. (A) Splenocytes from either wild-type or ALX-deficient mice were harvested and resuspended at 100 × 106 cells/ml in PBS, stimulated with cross-linked anti-CD3 (2C11) as described in Materials and Methods, and examined for total phosphotyrosine by Western blotting with 4G10. (B) Thymocytes from either wild-type or ALX-deficient mice were examined for their abilities to flux calcium in response to CD3 cross-linking by FACS analysis. Arrows indicate the times at which streptavidin cross-linker (crosslink) and ionomycin (iono.) were added to each sample. Calcium flux is shown for CD4+ (top panel), CD4+ CD8+ double-positive (DP) (middle panel), and CD8+ single-positive (bottom panel) thymocytes. WT and KO lines show the calcium flux in the indicated types of thymocytes. Shown are representative data from three independent experiments. (C and D) Splenocytes from wild-type and ALX-deficient mice were stimulated as described in Materials and Methods with either CD3 or CD3/CD28 over a 45-min time course to examine the phosphorylation status of various signaling intermediates during T-cell activation. PMA was used as a positive control. Within each set, parallel blots were generated by utilizing the same stimulated samples to examine phosphorylated as well as total protein expression. WT, wild type; KO, ALX deficient.
FIG. 8.
FIG. 8.
Association of ALX with the transmembrane adaptor LAX. Expression plasmids for myc-tagged LAT and LAX were cotransfected into 293T cells with YFP-tagged ALX along with the appropriate vector controls. The following day, cells were lysed in NP-40 lysis buffer and immunoprecipitated (IP) with anti-myc antibody, and the immunoprecipitated complexes were eluted from the protein A beads with an excess of myc peptide. Whole-cell lysates and immunoprecipitates were then examined by Western blotting (WB) with antibodies recognizing the myc tag or with antibodies to ALX. WCE, whole-cell extract.

Similar articles

Cited by

References

    1. Chambers, C. A., and J. P. Allison. 1997. Co-stimulation in T cell responses. Curr. Opin. Immunol. 9:396-404. - PubMed
    1. Chen, C. Y., F. Del Gatto-Konczak, Z. Wu, and M. Karin. 1998. Stabilization of interleukin-2 mRNA by the c-Jun NH2-terminal kinase pathway. Science 280:1945-1949. - PubMed
    1. Choi, Y. B., C. K. Kim, and Y. Yun. 1999. Lad, an adapter protein interacting with the SH2 domain of p56lck, is required for T cell activation. J. Immunol. 163:5242-5249. - PubMed
    1. Dong, C., R. J. Davis, and R. A. Flavell. 2002. MAP kinases in the immune response. Annu. Rev. Immunol. 20:55-72. - PubMed
    1. Espel, E. 2005. The role of the AU-rich elements of mRNAs in controlling translation. Semin. Cell Dev. Biol. 16:59-67. - PubMed

Publication types

MeSH terms