

Adenosine-evoked Na+ transport in human airway epithelial cells
- PMID: 16880767
- PMCID: PMC1629408
- DOI: 10.1038/sj.bjp.0706822
Adenosine-evoked Na+ transport in human airway epithelial cells
Abstract
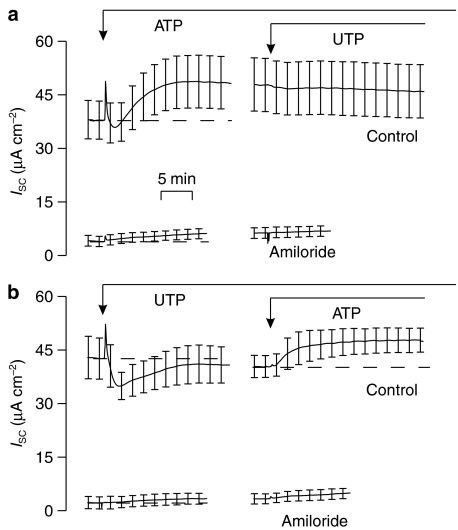
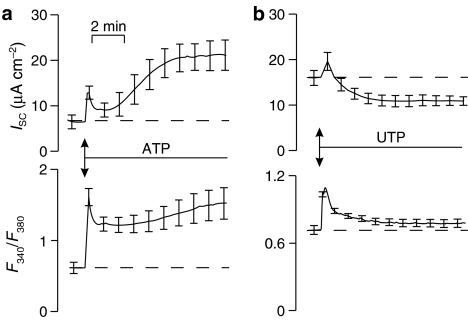
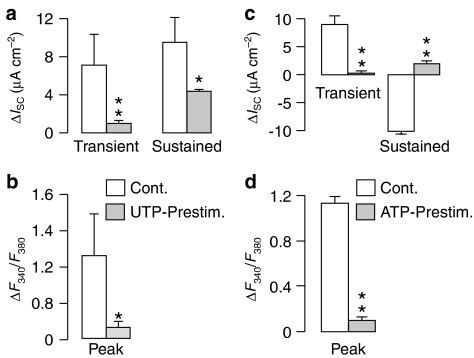
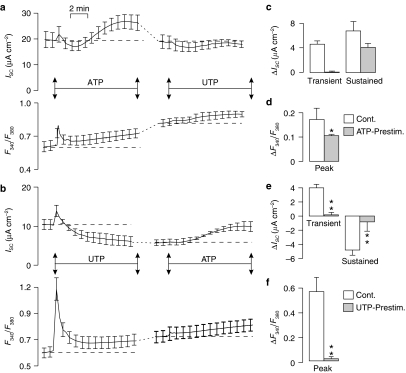
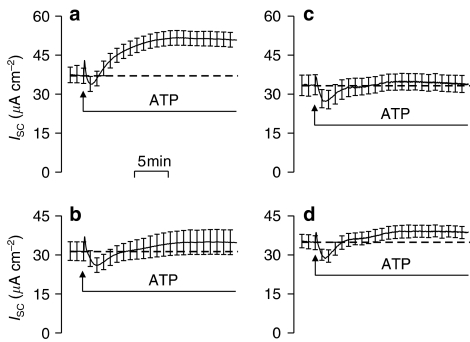
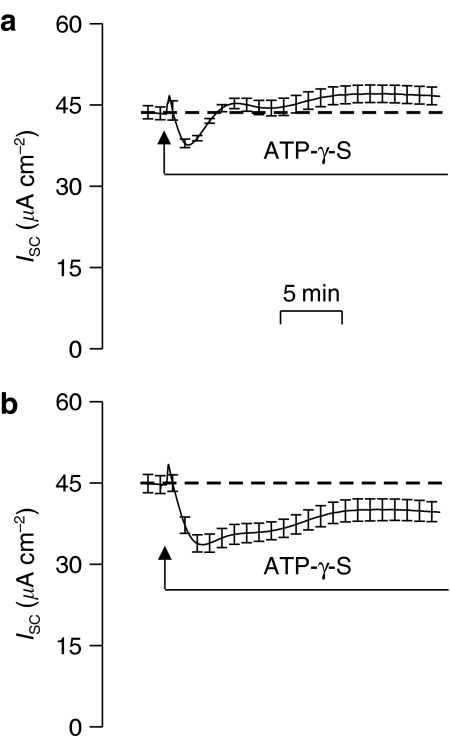
Background and purpose: Absorptive epithelia express apical receptors that allow nucleotides to inhibit Na(+) transport but ATP unexpectedly stimulated this process in an absorptive cell line derived from human bronchiolar epithelium (H441 cells) whilst UTP consistently caused inhibition. We have therefore examined the pharmacological basis of this anomalous effect of ATP.
Experimental approach: H441 cells were grown on membranes and the short circuit current (I(SC)) measured in Ussing chambers. In some experiments, [Ca(2+)](i) was measured fluorimetrically using Fura -2. mRNAs for adenosine receptors were determined by the polymerase chain reaction (PCR).
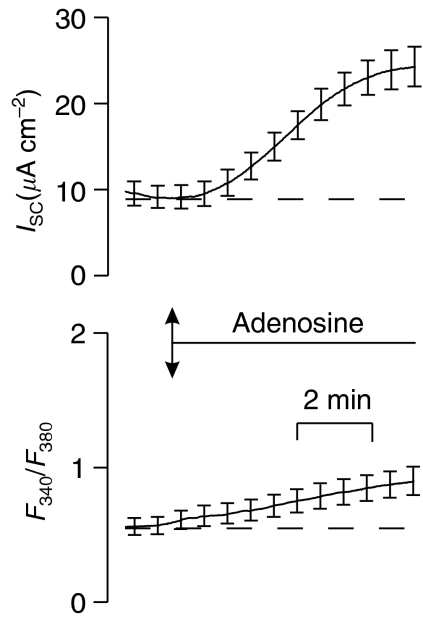
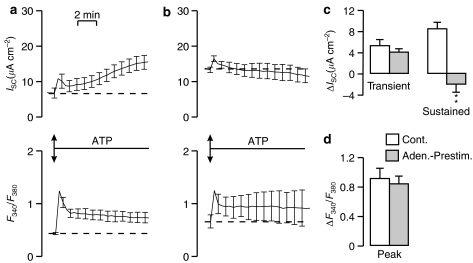
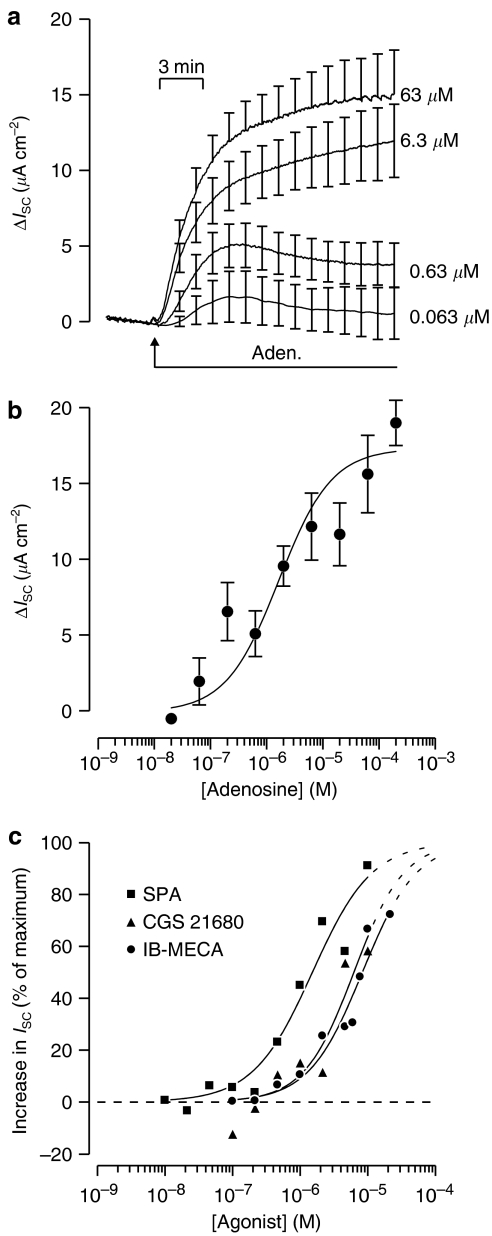
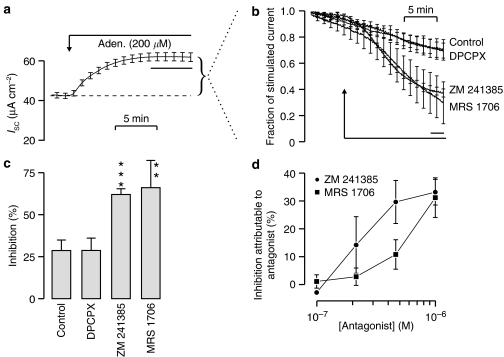
Key results: Cross desensitization experiments showed that the inhibitory response to UTP was abolished by prior exposure to ATP whilst the stimulatory response to ATP persisted in UTP-pre-stimulated cells. Apical adenosine evoked an increase in I(SC) and this response resembled the stimulatory component of the response to ATP, and could be mimicked by adenosine receptor agonists. Pre-stimulation with adenosine abolished the stimulatory component of the response to ATP. mRNA encoding A(1), A(2A) and A(2B) receptor subtypes, but not the A(3) subtype, was detected in H441 cells and adenosine receptor antagonists could abolish the ATP-evoked stimulation of Na(+) absorption.
Conclusions and implications: The ATP-induced stimulation of Na(+) absorption seems to be mediated via A(2A/B) receptors activated by adenosine produced from the extracellular hydrolysis of ATP. The present data thus provide the first description of adenosine-evoked Na(+) transport in airway epithelial cells and reveal a previously undocumented aspect of the control of this physiologically important ion transport process.
Figures
Similar articles
-
Differential effects of UTP and ATP on ion transport in porcine tracheal epithelium.Br J Pharmacol. 2000 May;130(2):367-74. doi: 10.1038/sj.bjp.0703324. Br J Pharmacol. 2000. PMID: 10807675 Free PMC article.
-
Differential regulations between adenosine triphosphate (ATP)- and uridine triphosphate-induced Cl(-) secretion in bovine tracheal epithelium. Direct stimulation of P1-like receptor by ATP.Am J Respir Cell Mol Biol. 2001 Sep;25(3):370-6. doi: 10.1165/ajrcmb.25.3.4382. Am J Respir Cell Mol Biol. 2001. PMID: 11588016
-
Regulation of ion transport via apical purinergic receptors in intact rabbit airway epithelium.Pflugers Arch. 2005 Jul;450(4):227-35. doi: 10.1007/s00424-005-1388-4. Epub 2005 Apr 9. Pflugers Arch. 2005. PMID: 15822001
-
Control of epithelial transport via luminal P2 receptors.Am J Physiol Renal Physiol. 2003 Mar;284(3):F419-32. doi: 10.1152/ajprenal.00075.2002. Am J Physiol Renal Physiol. 2003. PMID: 12556361 Review.
-
Purinergic receptors in airway epithelia.Curr Opin Pharmacol. 2009 Jun;9(3):262-7. doi: 10.1016/j.coph.2009.02.004. Epub 2009 Mar 13. Curr Opin Pharmacol. 2009. PMID: 19285919 Free PMC article. Review.
Cited by
-
Adenosine receptors in rat and human pancreatic ducts stimulate chloride transport.Pflugers Arch. 2008 May;456(2):437-47. doi: 10.1007/s00424-007-0403-3. Epub 2007 Dec 5. Pflugers Arch. 2008. PMID: 18057956
-
Expression of intermediate-conductance, Ca2+-activated K+ channel (KCNN4) in H441 human distal airway epithelial cells.Am J Physiol Lung Cell Mol Physiol. 2006 Nov;291(5):L957-65. doi: 10.1152/ajplung.00065.2006. Epub 2006 Jun 9. Am J Physiol Lung Cell Mol Physiol. 2006. PMID: 16766578 Free PMC article.
-
Adenosine signaling and the regulation of chronic lung disease.Pharmacol Ther. 2009 Jul;123(1):105-16. doi: 10.1016/j.pharmthera.2009.04.003. Epub 2009 May 5. Pharmacol Ther. 2009. PMID: 19426761 Free PMC article. Review.
-
A2B adenosine receptors regulate the mucus clearance component of the lung's innate defense system.Am J Respir Cell Mol Biol. 2008 Aug;39(2):190-7. doi: 10.1165/rcmb.2007-0450OC. Epub 2008 Mar 26. Am J Respir Cell Mol Biol. 2008. PMID: 18367727 Free PMC article.
-
AICAR activates AMPK and alters PIP2 association with the epithelial sodium channel ENaC to inhibit Na+ transport in H441 lung epithelial cells.J Physiol. 2008 Sep 15;586(18):4541-57. doi: 10.1113/jphysiol.2008.158253. Epub 2008 Jul 31. J Physiol. 2008. PMID: 18669532 Free PMC article.
References
-
- Berridge MJ. Inositol trisphosphate and calcium signalling. Nature. 1993;361:315–325. - PubMed
-
- Boucher RC. New concepts of the pathogenesis of cystic fibrosis lung disease. Eur Respir J. 2004;23:146–158. - PubMed
-
- Bouritius H, Groot JA. Apical adenosine activates an amiloride-sensitive conductance in human intestinal cell line HT29cl19A. Am J Physiol Cell Physiol. 1997;272:C931–C936. - PubMed
-
- Brown HA, Lazarowski ER, Boucher RC, Harden TK. Evidence that UTP and ATP regulate phospholipase C through a common extracellular 5′-nucleotide receptor in human airway epithelial cells. Mol Pharmacol. 1991;40:648–655. - PubMed
-
- Canessa CM, Horisberger JD, Rossier BC. Epithelial sodium channel related to proteins involved in neurodegeneration. Nature. 1993;361:467–470. - PubMed
Publication types
MeSH terms
Substances
Grants and funding
LinkOut - more resources
Full Text Sources
Miscellaneous
