. 2006 Sep;3(9):e361.
doi: 10.1371/journal.pmed.0030361.

Reducing the impact of the next influenza pandemic using household-based public health interventions

Affiliations

Reducing the impact of the next influenza pandemic using household-based public health interventions

Joseph T Wu et al. PLoS Med. 2006 Sep.

Abstract

Background: The outbreak of highly pathogenic H5N1 influenza in domestic poultry and wild birds has caused global concern over the possible evolution of a novel human strain [1]. If such a strain emerges, and is not controlled at source [2,3], a pandemic is likely to result. Health policy in most countries will then be focused on reducing morbidity and mortality.

Methods and findings: We estimate the expected reduction in primary attack rates for different household-based interventions using a mathematical model of influenza transmission within and between households. We show that, for lower transmissibility strains [2,4], the combination of household-based quarantine, isolation of cases outside the household, and targeted prophylactic use of anti-virals will be highly effective and likely feasible across a range of plausible transmission scenarios. For example, for a basic reproductive number (the average number of people infected by a typically infectious individual in an otherwise susceptible population) of 1.8, assuming only 50% compliance, this combination could reduce the infection (symptomatic) attack rate from 74% (49%) to 40% (27%), requiring peak quarantine and isolation levels of 6.2% and 0.8% of the population, respectively, and an overall anti-viral stockpile of 3.9 doses per member of the population. Although contact tracing may be additionally effective, the resources required make it impractical in most scenarios.

Conclusions: National influenza pandemic preparedness plans currently focus on reducing the impact associated with a constant attack rate, rather than on reducing transmission. Our findings suggest that the additional benefits and resource requirements of household-based interventions in reducing average levels of transmission should also be considered, even when expected levels of compliance are only moderate.


Conflict of interest statement

Competing Interests: The authors have declared that no competing interests exist.

Figures

Figure 1
Figure 1. The Natural History Assumed for Pandemic Influenza
Individuals progress from S (susceptible) through E (exposed but not yet infectious), IP (infectious but not yet symptomatic), IA (infectious and asymptomatic), IS (infectious and symptomatic), IH (infectious and suffering symptoms severe enough to be hospitalized), and R (recovered and presumed immune). All deaths occur in the IH stage. We used recent results [2] derived from a symptom-based household study [15] for the waiting time of the combined E and IP stages: it is distributed according to an offset Weibull with offset +0.5 d, mean 1.48 d (including the offset), and standard deviation 0.47 d. The duration of the IP stage was assumed to be fixed at 0.5 d. The duration of the IS stage was set to be 5/3 that of the IA stage, but the absolute duration of both stages was determined by the generation time, T g (see main text and Table 1). In the model, 33% of infections were never symptomatic, which is consistent with sources: a basic reproductive number of 1.8 [2] with a 50% case attack rate [24], and observations from deliberate infections of humans with H1N1 [25]. We assumed that 6.0% of symptomatic infections resulted in hospitalization and 17.2% of these resulted in death (nonpandemic data for community-acquired pneumonia extracted from the Hospital Authority Integrated Patient Administrative System, Hospital Authority, Hong Kong Special Administrative Region, 2002). The 6% hospitalization rate is consistent with the overall 1918 pandemic mortality rate (derived from analyses of the 1918 pandemic; see Discussion)—67% of infections being symptomatic—and with the case fatality rate for all community-acquired pneumonia admissions to Hong Kong public hospitals. We assumed that all children and 50% of adults stay at home when symptomatic with influenza—even when no interventions are in force (consistent with [20]). This assumption is to ensure that the impact of quarantine is not overestimated. Note that this parameter was not included in the sensitivity analyses as its impact was dominated by θ, the proportion of presymptomatic or asymptomatic transmission. Half of transmission outside the home was assumed to be in the peer group, the other half was between random pairs of infector and infectee who would not have been able to name each other during a contact tracing interview.
Figure 2
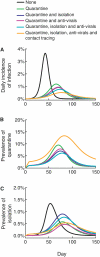
Figure 2. Baseline Transmission (None) and Five Intervention Scenarios: Q, QI, QA, QIA, and QIAC
(A) shows the incidence of infection, (B) the percentage of the population living in homes that were quarantined, and (C) the percentage of the population in isolation. We assumed that infectivity within households increased by 100% for each individual who complied with quarantine. For peer groups, quarantine reduced both transmissibility and susceptibility to 25% of the nonquarantined level. Therefore, the rate of transmission decreased by 75% within a peer group when one of two infected individuals complied with quarantine and by 96% if both did. For the results presented here, we assumed a compliance rate of 50% (see Methods). If individuals complied, they were not infectious to the wider community. When anti-viral treatments were used they reduced susceptibility to 30% of its baseline value and transmissibility to 69% of its baseline value. These are the conservative bounds of the 95% confidence intervals from analyses of clinical trial data for oseltamivir [8]. Results presented here are averages of 100 realizations in a population of 1,000,000 individuals, but there was no significant change for populations of 500,000 or 2,000,000. The 95% stochastic prediction intervals (not shown) do vary with population size, but are narrow (less than 5% deviation from mean values) for simulations in populations of 1,000,000.
Figure 3
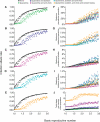
Figure 3. Multivariate Sensitivity Analyses
(A–E) The efficacy of different household-based intervention policies (same color key as in Figure 2) compared to taking no action for 200 random samples, selected using a Latin hypercube [17], across a multivariate range of transmission parameters (see Table 1). The y-axes show the expected IAR for the first wave. Variation in IAR for a given R 0 is driven by variation in other transmission parameters rather than by stochastic variation. (F–J) The maximum prevalence and incidence of quarantine and isolation and the total number of drug doses used per member of the population (same color key as in [A–E]). For maximum values, the average of individual realization maximums is used as the overall maximum. Incidences are daily. We assume that all isolated individuals (including those who are hospitalized) receive anti-viral treatment. Results presented here are averages of 100 realizations in a population of 500,000 individuals. Sub-samples at 1,000,000 show no significant differences in these patterns. R 0 values are based on formula image , the average number of secondary cases generated by an individual chosen at random in an otherwise susceptible population: formula image (see Figure S3).
Figure 4
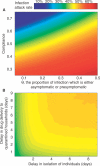
Figure 4. Bivariate Sensitivity Analyses
(A) The sensitivity of our estimates of the efficacy of Q to changes in the compliance rate and to changes in θ, the proportion of infections that are either asymptomatic or presymptomatic. (B) The sensitivity of our estimates of the efficacy of QIA to changes in the delay in the delivery of drugs to quarantined households and to changes in the delay in the isolation of individuals. All other parameters are held constant at their baseline values (see Figure 1 and Table 1).

References

    1. Clayton J. Looming flu pandemic has experts crying fowl. Nat Med. 2003;9:375. - PubMed
    1. Ferguson NM, Cummings DAT, Cauchemez S, Fraser C, Riley S, et al. Strategies for containing an emerging influenza pandemic in Southeast Asia. Nature. 2005;437:209–214. - PubMed
    1. Longini IM, Nizam A, Xu SF, Ungchusak K, Hanshaoworakul W, et al. Containing pandemic influenza at the source. Science. 2005;309:1083–1087. - PubMed
    1. Mills CE, Robins JM, Lipsitch M. Transmissibility of 1918 pandemic influenza. Nature. 2004;432:904–906. - PMC - PubMed
    1. Heesterbeek JAP. A brief history of R-0 and a recipe for its calculation. Acta Biotheor. 2002;50:189–204. - PubMed

Publication types

MeSH terms

Substances