

Crystallographic analysis of calcium-dependent heparin binding to annexin A2
- PMID: 16882661
- PMCID: PMC4129640
- DOI: 10.1074/jbc.M604502200
Crystallographic analysis of calcium-dependent heparin binding to annexin A2
Abstract
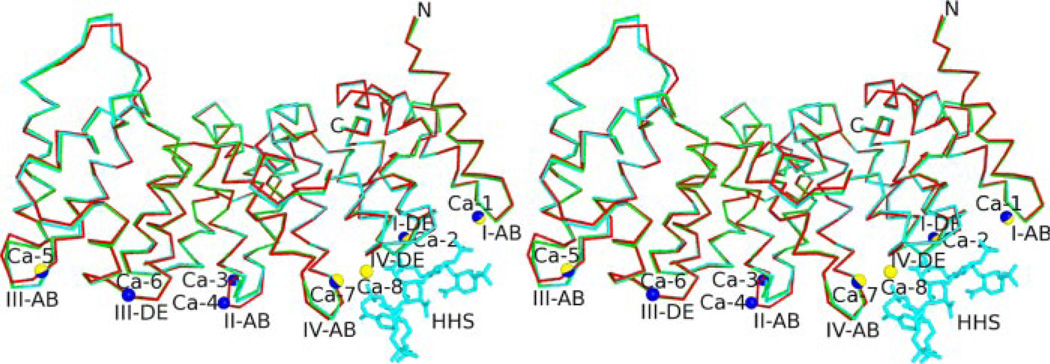
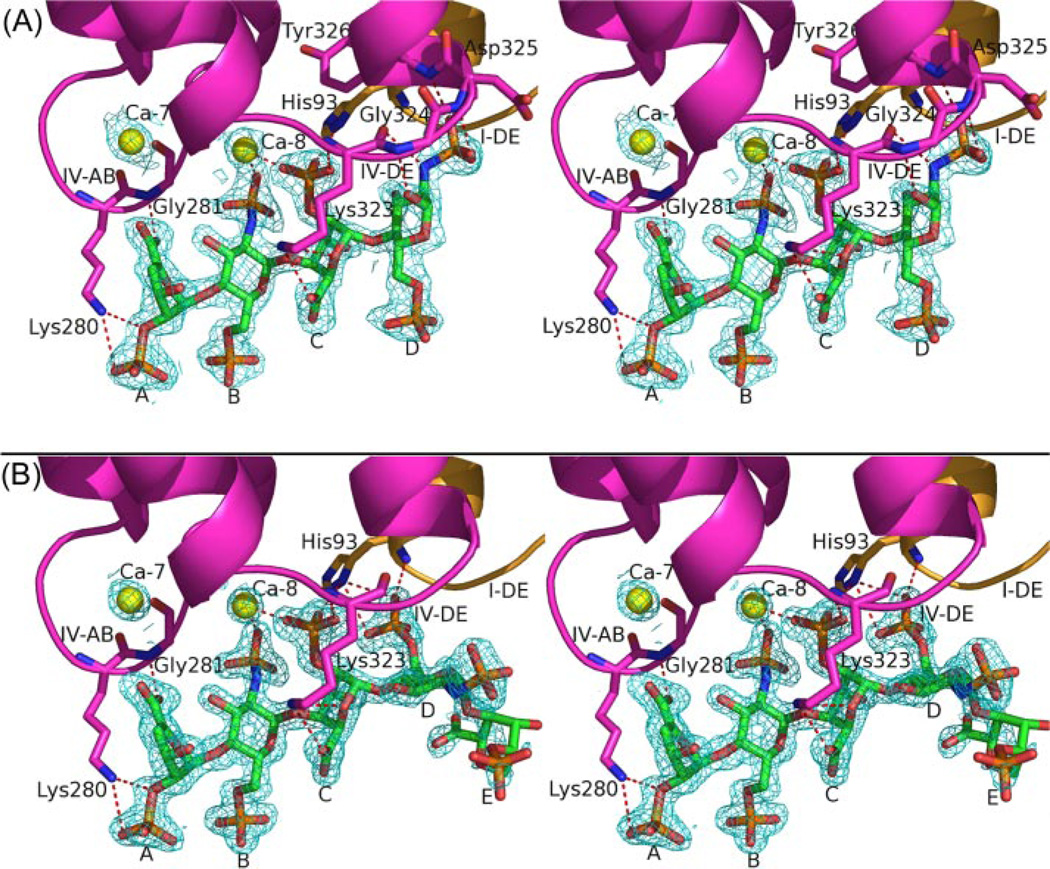
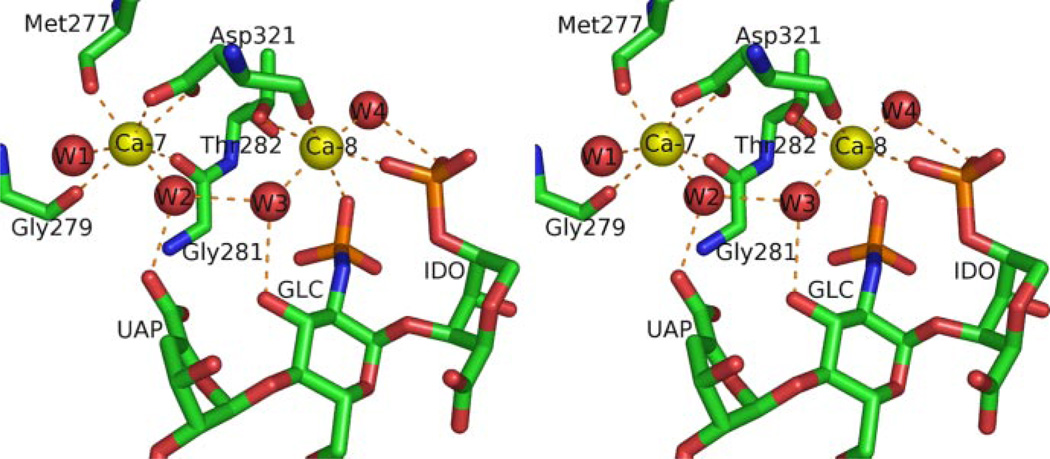
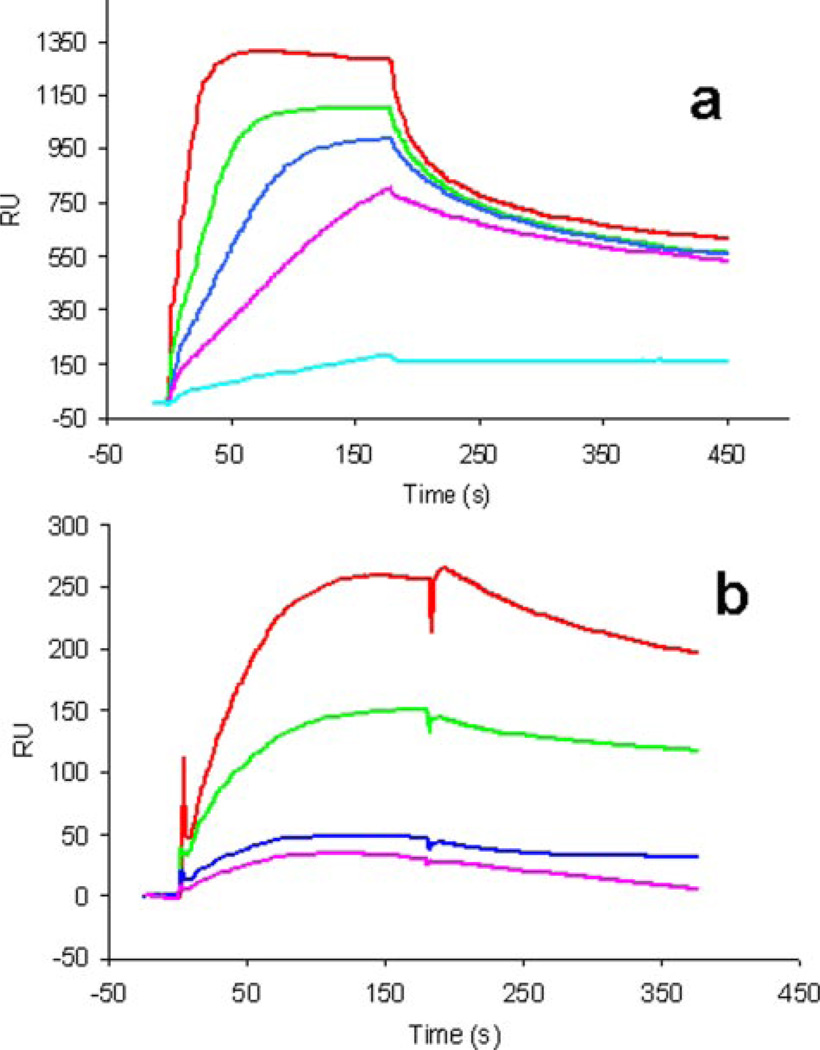
Annexin A2 and heparin bind to one another with high affinity and in a calcium-dependent manner, an interaction that may play a role in mediating fibrinolysis. In this study, three heparin-derived oligosaccharides of different lengths were co-crystallized with annexin A2 to elucidate the structural basis of the interaction. Crystal structures were obtained at high resolution for uncomplexed annexin A2 and three complexes of heparin oligosaccharides bound to annexin A2. The common heparin-binding site is situated at the convex face of domain IV of annexin A2. At this site, annexin A2 binds up to five sugar residues from the nonreducing end of the oligosaccharide. Unlike most heparin-binding consensus patterns, heparin binding at this site does not rely on arrays of basic residues; instead, main-chain and side-chain nitrogen atoms and two calcium ions play important roles in the binding. Especially significant is a novel calcium-binding site that forms upon heparin binding. Two sugar residues of the heparin derivatives provide oxygen ligands for this calcium ion. Comparison of all four structures shows that heparin binding does not elicit a significant conformational change in annexin A2. Finally, surface plasmon resonance measurements were made for binding interactions between annexin A2 and heparin polysaccharide in solution at pH 7.4 or 5.0. The combined data provide a clear basis for the calcium dependence of heparin binding to annexin A2.
Figures
Similar articles
-
Annexin V--heparin oligosaccharide complex suggests heparan sulfate--mediated assembly on cell surfaces.Structure. 2001 Jan 10;9(1):57-64. doi: 10.1016/s0969-2126(00)00549-9. Structure. 2001. PMID: 11342135
-
Phospholipid-associated annexin A2-S100A10 heterotetramer and its subunits: characterization of the interaction with tissue plasminogen activator, plasminogen, and plasmin.J Biol Chem. 2003 Jul 11;278(28):25577-84. doi: 10.1074/jbc.M301017200. Epub 2003 Apr 30. J Biol Chem. 2003. PMID: 12730231
-
Engineering, biophysical characterisation and binding properties of a soluble mutant form of annexin A2 domain IV that adopts a partially folded conformation.J Mol Biol. 2006 Oct 20;363(2):469-81. doi: 10.1016/j.jmb.2006.08.042. Epub 2006 Aug 22. J Mol Biol. 2006. PMID: 16963080
-
S100A10, annexin A2, and annexin a2 heterotetramer as candidate plasminogen receptors.Front Biosci. 2005 Jan 1;10:300-25. doi: 10.2741/1529. Print 2005 Jan 1. Front Biosci. 2005. PMID: 15574370 Review.
-
Annexin V-crystal structure and its implications on function.Behring Inst Mitt. 1992 Apr;(91):107-25. Behring Inst Mitt. 1992. PMID: 1388018 Review.
Cited by
-
Coarse-grained modeling of annexin A2-induced microdomain formation on a vesicle.Biophys J. 2024 Aug 20;123(16):2431-2442. doi: 10.1016/j.bpj.2024.06.006. Epub 2024 Jun 10. Biophys J. 2024. PMID: 38859585 Free PMC article.
-
Modernized uniform representation of carbohydrate molecules in the Protein Data Bank.Glycobiology. 2021 Sep 20;31(9):1204-1218. doi: 10.1093/glycob/cwab039. Glycobiology. 2021. PMID: 33978738 Free PMC article.
-
Extracellular vesicles released by glioma cells are decorated by Annexin A2 allowing for cellular uptake via heparan sulfate.Cancer Gene Ther. 2023 Aug;30(8):1156-1166. doi: 10.1038/s41417-023-00627-w. Epub 2023 May 25. Cancer Gene Ther. 2023. PMID: 37231059
-
Dynamics of Bovine Sperm Interaction with Epithelium Differ Between Oviductal Isthmus and Ampulla.Biol Reprod. 2016 Oct;95(4):90. doi: 10.1095/biolreprod.116.140632. Epub 2016 Sep 7. Biol Reprod. 2016. PMID: 27605344 Free PMC article.
-
Modulatory effects of fibronectin on calcium oxalate crystallization, growth, aggregation, adhesion on renal tubular cells, and invasion through extracellular matrix.J Biol Inorg Chem. 2019 Mar;24(2):235-246. doi: 10.1007/s00775-019-01641-w. Epub 2019 Jan 30. J Biol Inorg Chem. 2019. PMID: 30701361
References
-
- Gerke V, Creutz CE, Moss SE. Nat. Rev. Mol. Cell Biol. 2005;6:449–461. - PubMed
-
- Waisman DM. Mol. Cell. Biochem. 1995;149:301–322. - PubMed
-
- Kang HM, Choi KS, Kassam G, Fitzpatrick SL, Kwon M, Waisman DM. Trends Cardiovasc. Med. 1999;9:92–102. - PubMed
-
- Hajjar KA, Acharya SS. Ann. N. Y. Acad. Sci. 2000;902:265–271. - PubMed
-
- Liang JF, Li Y, Yang VC. Thromb. Res. 2000;97:349–358. - PubMed
Publication types
MeSH terms
Substances
Associated data
- Actions
- Actions
- Actions
Grants and funding
LinkOut - more resources
Full Text Sources
Other Literature Sources
Medical
