. 2006 Aug 15;20(16):2202-7.
doi: 10.1101/gad.1444406. Epub 2006 Aug 1.

Extensive post-transcriptional regulation of microRNAs and its implications for cancer

Affiliations

Extensive post-transcriptional regulation of microRNAs and its implications for cancer

J Michael Thomson et al. Genes Dev. .

Abstract

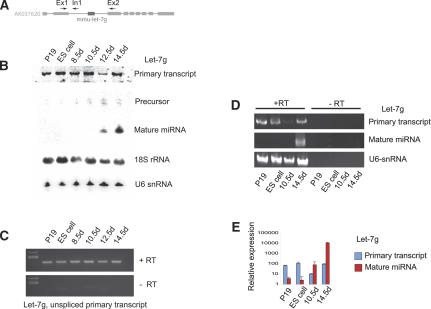
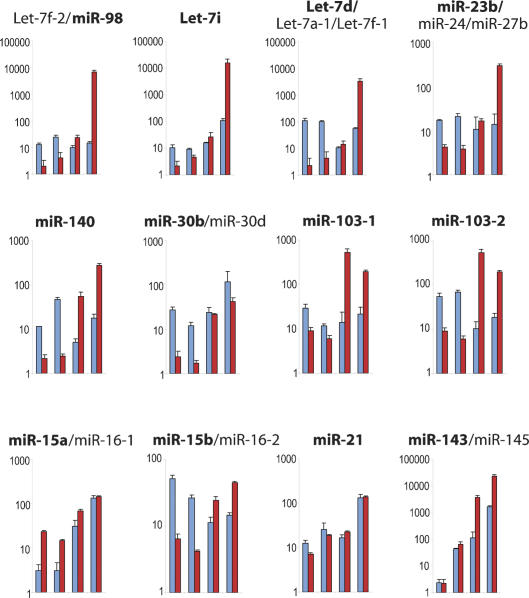
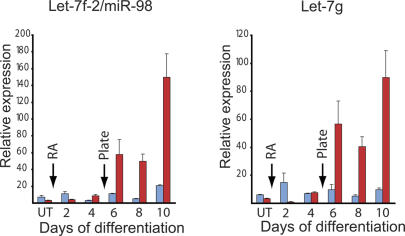
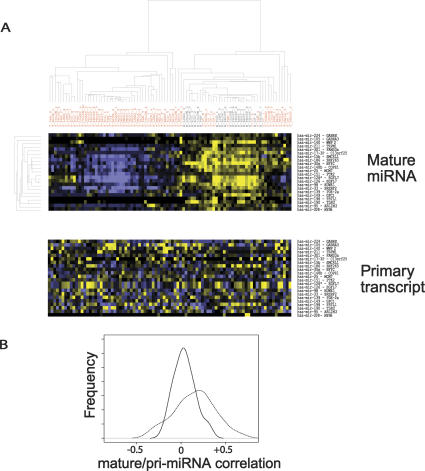
MicroRNAs (miRNAs) are short, noncoding RNAs that post-transcriptionally regulate gene expression. While hundreds of mammalian miRNA genes have been identified, little is known about the pathways that regulate the production of active miRNA species. Here we show that a large fraction of miRNA genes are regulated post-transcriptionally. During early mouse development, many miRNA primary transcripts, including the Let-7 family, are present at high levels but are not processed by the enzyme Drosha. An analysis of gene expression in primary tumors indicates that the widespread down-regulation of miRNAs observed in cancer is due to a failure at the Drosha processing step. These data uncover a novel regulatory step in miRNA function and provide a mechanism for miRNA down-regulation in cancer.


Figures

Figure 1.
Figure 1.
Expression of let-7g during mouse development. (A) The genomic organization of Let-7g is shown. RT-PCR primer sites are indicated by arrows. Primers Ex1 and Ex2 were used for PCR of the primary transcript. Primers Ex1 and In1 were used for PCR of the unspliced primary transcript. (B) Northern blot analysis of the molecular species of Let-7g. 18S rRNA and U6 snRNA were used for loading controls for pri-miRNA and pre-miRNA/mature, respectively. (C) Nonquantitative RT-PCR of the unspliced primary transcript. Control reactions without the reverse transcription step are shown. (D) Nonquantitative RT-PCR of the let-7g primary transcript and mature species. The U6-snRNA reference is also shown. The right lanes are control reactions without reverse transcription step. (E) Real-time RT-PCR analysis of the let-7g primary transcript and mature species. Reactions were performed in triplicate and normalized to U6 cycle threshold values. Expression is shown as relative values on a logarithmic scale.
Figure 2.
Figure 2.
miRNA expression during mouse development. The expression levels of primary transcript and mature species from 12 representative miRNAs are shown. Red bars represent mature miRNA, and blue bars represent primary transcript. All analyses are performed with the following RNA samples, from left to right: P19 teratocarcinoma cell line; embryonic stem cell line; 10.5-d gestation mouse embryo; 14.5-d gestation mouse embryo. Reactions were performed in triplicate and normalized to U6 cycle threshold values. Expression is shown as relative values on a logarithmic scale. The bold font indicates the mature miRNA gene that was used for RTPCR analysis. In all cases, these are unique miRNA sequences in the mouse genome.
Figure 3.
Figure 3.
miRNA expression during P19 cell differentiation. P19 teratocarcinoma cells were differentiated by forming embryoid bodies for 4 d in the presence of all-trans retinoic acid (RA), followed by plating without RA. Arrows indicate RA treatment and plating time. Primary transcript and mature miRNA species were quantitated by real-time RT-PCR. Reactions were performed in triplicate and normalized to U6 cycle threshold values. Expression is shown as relative values on a linear scale. Red bars indicate mature miRNA, and blue bars indicate pri-miRNA.
Figure 4.
Figure 4.
miRNA expression in primary tumors. (A) Normalized miRNA expression data from Lu et al. (2005) were clustered hierarchically in both dimensions and are displayed as an expression map. Yellow indicates increased expression, and blue indicates decreased expression, relative to the median. Primary transcript expression data from Ramaswamy et al. (2001) were mapped in the same order as the mature miRNA expression map. Mature miRNA/ primary transcript gene pairs are indicated on the right. Tumor samples are indicated in red, and normal tissues are indicated in black. (B) Pearson correlation values for each mature/primiRNA value pair were calculated. Values for normal samples (dashed line) and tumor samples (solid line) are plotted as a histogram.

References

    1. Aravin A., Tuschl T. Identification and characterization of small RNAs involved in RNA silencing. FEBS Lett. 2005;579:5830–5840. - PubMed
    1. Bracht J., Hunter S., Eachus R., Weeks P., Pasquinelli A.E. Trans-splicing and polyadenylation of let-7 microRNA primary transcripts. RNA. 2004;10:1586–1594. - PMC - PubMed
    1. Chen J.F., Mandel E.M., Thomson J.M., Wu Q., Callis T.E., Hammond S.M., Conlon F.L., Wang D.Z. The role of microRNA-1 and microRNA-133 in skeletal muscle proliferation and differentiation. Nat. Genet. 2006;38:228–233. - PMC - PubMed
    1. Du T., Zamore P.D. microPrimer: The biogenesis and function of microRNA. Development. 2005;132:4645–4652. - PubMed
    1. Eis P.S., Tam W., Sun L., Chadburn A., Li Z., Gomez M.F., Lund E., Dahlberg J.E. Accumulation of miR-155 and BIC RNA in human B cell lymphomas. Proc. Natl. Acad. Sci. 2005;102:3627–3632. - PMC - PubMed

Publication types

MeSH terms

LinkOut - more resources