. 2006 Aug 1;20(15):2030-40.
doi: 10.1101/gad.386106.

The transcriptional activity of RNA polymerase I is a key determinant for the level of all ribosome components

Affiliations

The transcriptional activity of RNA polymerase I is a key determinant for the level of all ribosome components

Arnaud Laferté et al. Genes Dev. .

Abstract

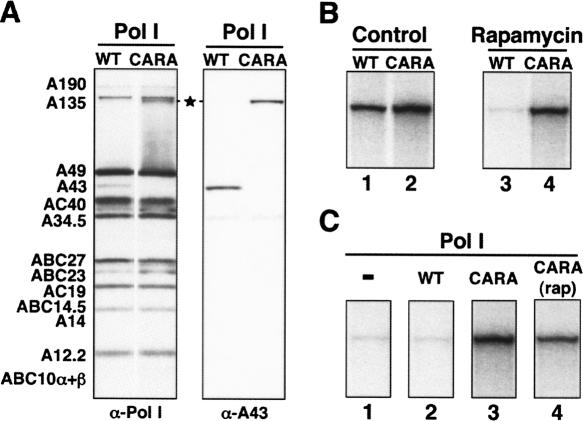
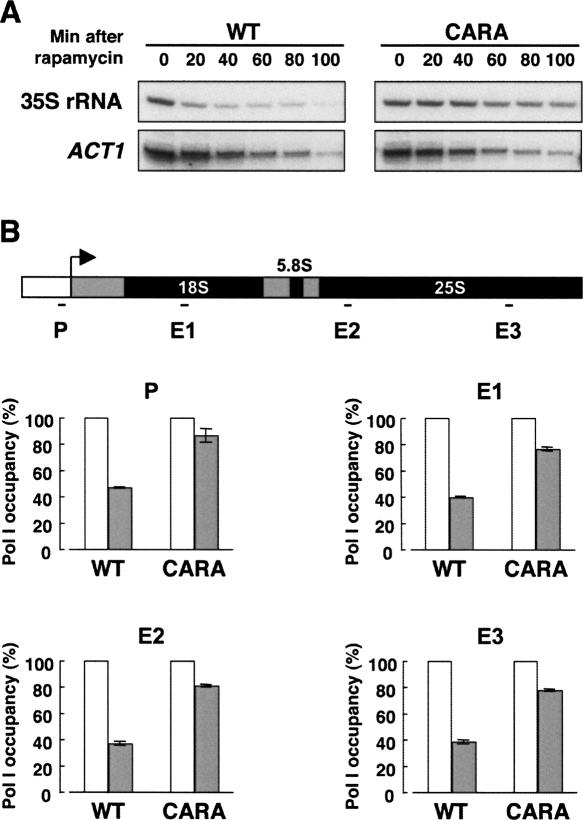
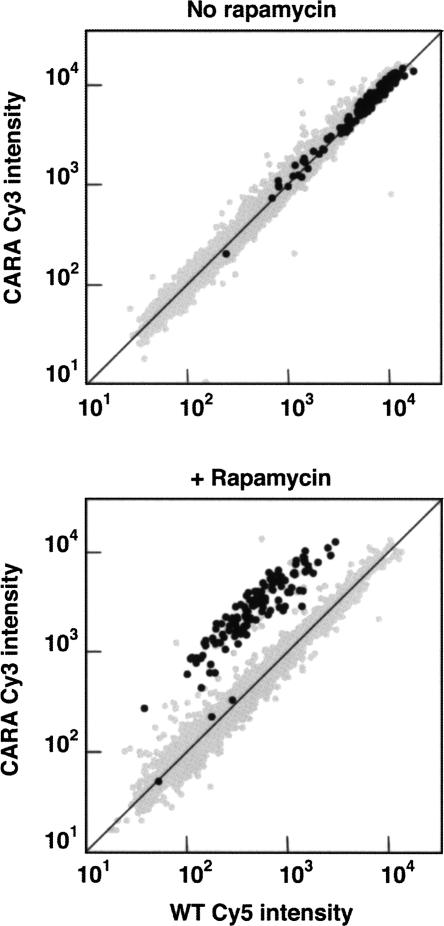
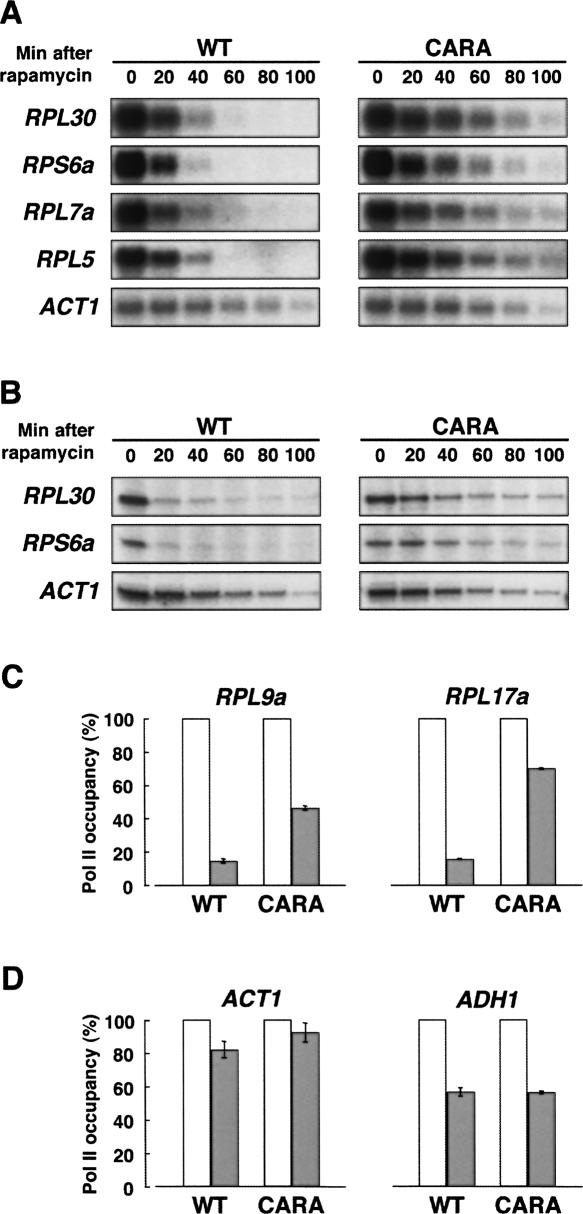
Regulation of ribosome biogenesis is a key element of cell biology, not only because ribosomes are directly required for growth, but also because ribosome production monopolizes nearly 80% of the global transcriptional activity in rapidly growing yeast cells. These observations underscore the need for a tight regulation of ribosome synthesis in response to environmental conditions. In eukaryotic cells, ribosome synthesis involves the activities of the three nuclear RNA polymerases (Pol). Although postulated, there is no clear evidence indicating whether the maintenance of an equimolar supply of ribosomal components reflects communication between the nuclear transcriptional machineries. Here, by constructing a yeast strain expressing a Pol I that remains constitutively competent for the initiation of transcription under stress conditions, we demonstrate that derepression of Pol I transcription leads to a derepression of Pol II transcription that is restricted to the genes encoding ribosomal proteins. Furthermore, we show that the level of 5S rRNA, synthesized by Pol III, is deregulated concomitantly with Pol I transcription. Altogether, these results indicate that a partial derepression of Pol I activity drives an abnormal accumulation of all ribosomal components, highlighting the critical role of the regulation of Pol I activity within the control of ribosome biogenesis.


Figures

Figure 1.
Figure 1.
Pol I from CARA cells mimics a nondissociable Pol I-Rrn3 complex. (A) Western blot analysis of purified Pol I. The subunit composition of the same amount of Pol I purified from wild-type (WT) or CARA cells grown in rich medium to mid–log phase was analyzed by Western blot using anti-Pol I or anti-A43 antibodies. Both forms of enzyme display the same subunit composition, except that the A43 protein is missing in the Pol I purified from CARA cells and is replaced by the Rrn3-A43 fusion protein (★), which is stably and stoichiometrically assembled. (B) Repression of in vitro Pol I transcription by rapamycin. WT or CARA cells were grown in rich medium to mid–log phase, treated with rapamycin for 30 min (Rapamycin) or not (Control), and then harvested at the same optical density (OD600 = 1.5). Partially purified extracts (PA600) from WT (lanes 1,3) or CARA cells (lanes 2,4) containing the same amount of Pol I (see Supplemental Fig. S3), were assayed for in vitro Pol I-specific transcription using a mini-rDNA gene as template. Without rapamycin treatment, efficient Pol I transcription is observed in both WT and CARA extracts (lanes 1,2). When cells were treated with rapamycin, traces of Pol I transcription were detected in WT extract (lane 3), whereas CARA extract remained fully active (lane 4). (C) Reactivation of rapamycin-treated WT cell extract. Extracts prepared from rapamycin-treated WT cells, deficient for Pol I transcription (lane 1) were complemented by addition of 200 ng of Pol I purified either from untreated WT cells (lane 2), untreated CARA cells (lane 3), or rapamycin-treated CARA cells (lane 4). Enzyme prepared from untreated and rapamycin-treated CARA cells reactivates Pol I transcription of rapamycin-treated WT cell extract, whereas Pol I prepared from WT cells has no effect.
Figure 2.
Figure 2.
In vivo deregulation of Pol I transcription in CARA cells. (A) Primer extension analyses of 35S rRNA and ACT1 mRNA. Wild-type (WT) or CARA cells were grown in rich medium to mid–log phase and rapamycin was added (t = 0 min). At the indicated times, the same number of cells were harvested, total RNAs were extracted, and the amount of 35S rRNA and ACT1 mRNA was determined by primer extension analysis. The decrease of the 35S rRNA level is attenuated in CARA cells compared with WT cells (see quantification in Supplemental Fig. S6), whereas the ACT1 mRNA level is identical in the two strains. (B) ChIP analysis of the occupancy of the 35S rDNA by Pol I. Chromatin extracts were prepared from the same number of WT or CARA cells grown in rich medium to mid–log phase either in the absence of rapamycin (white histograms) or after a 20-min rapamycin treatment (gray histograms). ChIP experiment was performed using anti-A190 antibodies. Quantification was performed by Real-Time PCR, and the occupancy of the 35S rDNA by Pol I at the promoter region (P) or along the transcribed region (E1 [+1430, +1536], E2 [+3551, +3657], and E3 [+5648, +5740] as indicated) after the rapamycin treatment is represented as a percentage of the occupancy without rapamycin. Standard deviation is calculated from two independent experiments. During the rapamycin treatment, the decrease of Pol I occupancy of the 35S rDNA is attenuated in CARA cells compared with WT cells.
Figure 3.
Figure 3.
Attenuated repression of Pol I transcription triggers deregulation of the 5S rRNA level. (A) In vivo labeling of mature rRNAs. Wild-type (WT) or CARA cells were grown in rich medium to mid–log phase before the addition of rapamycin (t = 0 min). At the indicated times, the same number of cells were collected and incubated with 150 μCi of [3H]-uracil for 20 min. Total RNAs were extracted and the same amount (3 μg; see Supplemental Fig. S7) was analyzed by gel electrophoresis under denaturating conditions prior to autoradiography. Attenuated repression of the synthesis of 25S, 18S, and 5.8S rRNAs by Pol I and of the level of 5S rRNA, synthesized by Pol III, is observed in CARA cells (see quantification in Supplemental Fig. S7). (B) ChIP analysis of the occupancy of the 5S rDNA by Pol III. Chromatin extracts were prepared from the same number of WT or CARA cells containing a HA-tagged C160 Pol III subunit (see Materials and Methods). Cells were grown in rich medium to mid–log phase either in the absence of rapamycin (white histograms) or after a 20-min rapamycin treatment (gray histograms). ChIP experiment was performed using anti-HA antibodies. Quantification was performed by Real-Time PCR, and the occupancy of the 5S rDNA by Pol III after the rapamycin treatment is represented as a percentage of the occupancy without rapamycin. Standard deviation is calculated from five independent experiments. During the rapamycin treatment, the decrease of Pol III occupancy onto the 5S rDNA is not significantly different between WT and CARA cells.
Figure 4.
Figure 4.
Attenuation of rapamycin-dependent Pol I transcription repression impairs specifically the level of mRNAs encoding r-proteins. Genome-wide analysis of expression levels of class II genes. Wild-type (WT) or CARA cells were grown in rich medium to OD600 = 1 (mid–log phase) and further incubated for 60 min with rapamycin (“+ Rapamycin”) or without rapamycin (“No rapamycin”). Cells were harvested and total RNAs were extracted. RNAs (20 μg) were labeled by reverse transcription in the presence of Cy5 dUTP (WT) or Cy3 dUTP (CARA) (see Materials and Methods) and used to probe a microarray harboring all yeast ORFs. Results were analyzed using the GeneSpring software (Silicon Genetics). A scatterplot representation of expression levels is displayed. Each individual spot corresponds to a gene, and its location on the diagonal indicates that the abundance of the corresponding mRNA is similar in both strains. mRNAs encoding r-protein genes (black spots) are present at the same level in untreated WT and CARA cells but are specifically overrepresented in CARA cells in the presence of rapamycin (from a threefold to a 13-fold factor, with an average factor of 7.7).
Figure 5.
Figure 5.
The deregulation of mRNAs encoding r-proteins in CARA cells during rapamycin treatment is exerted at the transcriptional level. (A,B) Northern blot and primer extension analyses. Wild-type (WT) or CARA cells were grown in rich medium to mid–log phase before rapamycin treatment (t = 0 min). At the indicated times, the same number of cells was harvested and total RNAs were extracted. (A) Northern blot analyses were performed using probes hybridizing to four r-protein mRNAs and to the control ACT1 mRNA, as indicated. (B) Using primer extension analyses, the amount of two r-protein mRNAs was determined, and the ACT1 mRNA was used as a control. For both experiments, the decrease in the level of mRNAs encoding r-proteins is attenuated in CARA cells compared with WT cells, while the level of the control ACT1 mRNA is similarly down-regulated in the two strains (see quantification in Supplemental Fig. S8A,B). (C,D) ChIP analysis of the occupancy of RPL9a, RPL17a (C) and ACT1, ADH1 (D) promoters by Pol II. Chromatin extracts were prepared from the same number of WT or CARA cells grown in rich medium to mid–log phase either in the absence of rapamycin (white histograms) or after a 20-min treatment (gray histograms). ChIP experiments were performed using anti-CTD antibodies. Quantification was performed by Real-Time PCR, and the occupancy of the different promoters by Pol II is represented as a percentage of the occupancy without rapamycin. Standard deviation is calculated from three independent experiments. During rapamycin treatment, the level of Pol II on the promoters of r-protein genes is higher in CARA cells than in WT cells, whereas the level of Pol II on the promoter of the two control genes ACT1 and ADH1 is identical in the two strains.
Figure 6.
Figure 6.
The excess of ribosomal components in CARA vs. wild-type cells is assembled into ribosomes during rapamycin treatment. Quantification of 40S and 60S ribosomal particles. Rapamycin was added to a mid–log phase culture of wild-type (WT) or CARA cells grown in rich medium. At the indicated times, 109 cells were withdrawn, resuspended in a buffer without MgCl2 (see Materials and Methods), and disrupted by vigorous vortexing in the presence of glass beads. After clarification, the lysate was loaded onto a 5%–35% linear gradient of sucrose, and 40S and 60S ribosomal particles were separated by centrifugation under dissociating conditions. Fractions were collected from the bottom, and the amount of 40S and 60S ribosomal particles was determined by measuring the absorbance at 254 nm. During rapamycin treatment, the amount of ribosomal particles decrease in WT and CARA cells, but this reduction is strongly attenuated in CARA cells.
Figure 7.
Figure 7.
Pol I activity impacts the transcriptional regulation of r-protein genes during diauxic growth transition. Genome-wide analysis of expression levels of class II genes. Wild-type (WT) or CARA cells were grown in rich medium either to mid–log phase or 90 min after the end of the log phase at the diauxic transition (as indicated in Supplemental Fig. S1). After total RNA extraction, 20 μg of RNAs were labeled by reverse transcription in the presence of Cy5 dUTP (WT) or Cy3 dUTP (CARA) (see Materials and Methods) and used to probe a microarray harboring all yeast ORFs. Results were analyzed using the GeneSpring software (Silicon Genetics). For all mRNAs, the ratio of expression in CARA cells over WT cells (CARA/WT) was calculated. These values were transformed to a log2 scale, and the resulting distribution of ratios is depicted (r-protein genes, black histograms; non-r-protein genes, white histograms). During the mid–log phase, the distribution of expression ratios for r-protein genes is centered on zero, indicating that these genes are similarly expressed in both strains. During diauxic transition, mRNAs encoding r-protein are significantly overrepresented in CARA cells compared with WT cells.

Comment in

References

    1. Briand J.F., Navarro F., Gadal O., Thuriaux P. Cross talk between tRNA and rRNA synthesis in Saccharomyces cerevisiae. Mol. Cell. Biol. 2001;21:189–195. - PMC - PubMed
    1. Brun R.P., Ryan K., Sollner-Webb B. Factor C*, the specific initiation component of the mouse RNA polymerase I holoenzyme, is inactivated early in the transcription process. Mol. Cell. Biol. 1994;14:5010–5021. - PMC - PubMed
    1. Clarke E.M., Peterson C.L., Brainard A.V., Riggs D.L. Regulation of the RNA polymerase I and III transcription systems in response to growth conditions. J. Biol. Chem. 1996;27:22189–22195. - PubMed
    1. Claypool J.A., French S.L., Johzuka K., Eliason K., Vu L., Dodd J.A., Beyer A.L., Nomura M. Tor pathway regulates Rrn3p-dependent recruitment of yeast RNA polymerase I to the promoter but does not participate in alteration of the number of active genes. Mol. Biol. Cell. 2004;15:946–956. - PMC - PubMed
    1. Cormack B.P., Struhl K. The TATA-binding protein is required for transcription by all three nuclear RNA polymerases in yeast cells. Cell. 1992;69:685–696. - PubMed

Publication types

MeSH terms

Substances