. 2006 Aug 1;20(15):2110-20.
doi: 10.1101/gad.1453406.

E4F1: a novel candidate factor for mediating BMI1 function in primitive hematopoietic cells

Affiliations

E4F1: a novel candidate factor for mediating BMI1 function in primitive hematopoietic cells

Jalila Chagraoui et al. Genes Dev. .

Abstract

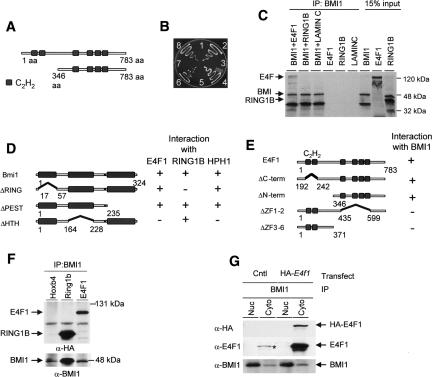
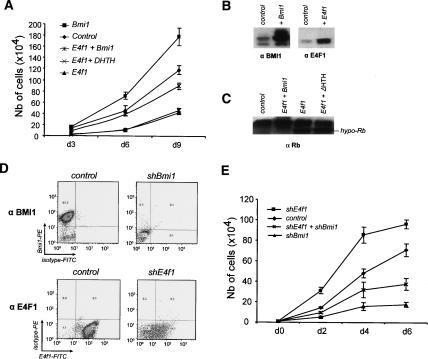
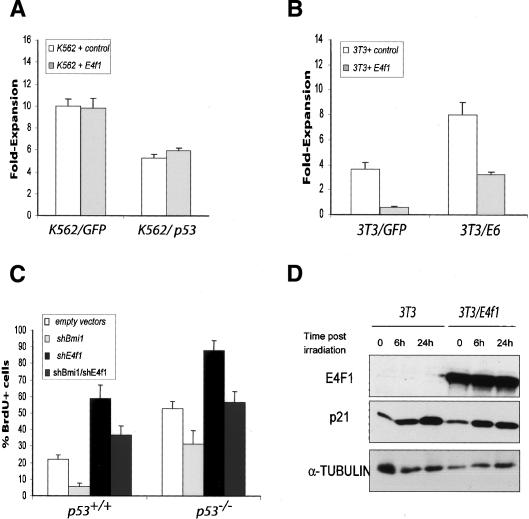
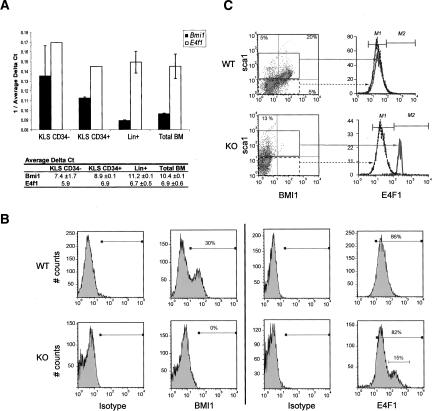
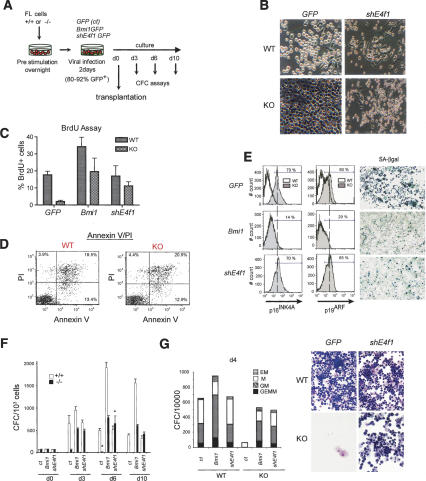
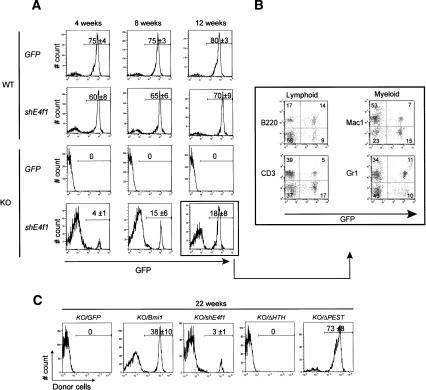
The Polycomb group gene Bmi1 is essential for the proliferation of neural and hematopoietic stem cells. Much remains to be learned about the pathways involved in the severe hematopoietic phenotype observed in Bmi1 homozygous mutant mice except for the fact that loss of p53 or concomitant loss of p16(Ink4a) and p19(Arf) functions achieves only a partial rescue. Here we report the identification of E4F1, an inhibitor of cellular proliferation, as a novel BMI1-interacting partner in hematopoietic cells. We provide evidence that Bmi1 and E4f1 genetically interact in the hematopoietic compartment to regulate cellular proliferation. Most importantly, we demonstrate that reduction of E4f1 levels through RNA interference mediated knockdown is sufficient to rescue the clonogenic and repopulating ability of Bmi1(-/-) hematopoietic cells up to 3 mo post-transplantation. Using cell lines and MEF, we also demonstrate that INK4A/ARF and p53 are not essential for functional interaction between Bmi1 and E4f1. Together, these findings identify E4F1 as a key modulator of BMI1 activity in primitive hematopoietic cells.


Figures

Figure 1.
Figure 1.
Identification of the BMI1 interacting protein E4F1. (A) Schematic representation of E4f1 and the isolated clone C-E4f1. (B) BMI1 specifically associates with E4F1 in yeast. AH109 yeast were cotransfected with GAL4-DNA binding (pGBKT7) and GAL4-transactivation domain (pGADT7 or pACT2) expression vectors encoding Bmi1, E4f1, Ring1b (positive control), and Large T antigen or Lamin C (both negative controls). Interactions were monitored between (1) BMI1 and Large T, (2,6) BMI1 and C-E4F1, (3) BMI1 and GAL4 AD, (4) GAL4 alone (5) C-E4F1 and Lamin C, (7) C-E4F1 and GAL4 DB, and (8) BMI1 and RING1B (positive control). (C) Direct physical association between BMI1 and E4F1. In vitro transcribed–translated 35S-labeled proteins were immunoprecipitated (IP) with an antibody specific to Bmi1 and separated by SDS-PAGE. (D,E) Interaction domain between BMI1 and E4F1 assessed in yeast. The correct folding of the Bmi1 deletion mutants was ensured by demonstrating their potential to interact with RING1B and HPH1, proteins known to interact with the RING and HTH domains of BMI1, respectively. (F) BMI1 and E4F1 specifically coimmunoprecipitate in mammalian cells. 293T cells were transfected with HA-HOXB4 (negative control), HA-RING1B (positive control), or an HA-tagged version of the C-terminal E4F1 fragment clone isolated in the screen. Immunoprecipitations were performed overnight on total cellular extracts using an antibody specific to BMI1. Western blots were revealed using anti-HA antibody. (G) BMI1 and E4F1 associate in the cytoplasm. Nuclear (Nuc) and cytoplasmic (Cyto) extracts were generated from HA-E4F1 and control K562 cells. Extracts were immunoprecipitated with an antibody to BMI1, and associated proteins were revealed by Western blotting with antibodies to HA, E4F1, and BMI1. (*, lane 2) Endogenous E4F1.
Figure 2.
Figure 2.
Genetic interaction between Bmi1 and E4f1 in NIH 3T3. (A) NIH 3T3 cells that express E4f1 or Bmi1, or coexpress E4f1 and Bmi1 were plated in triplicate, and counted at the indicated time points. Cells were collected at day 9 and analyzed by Western blot for the expression of (B) BMI1 and E4F1 or (C) Rb protein (hypo-Rb:hypophosphorylated Rb). (D) NIH 3T3 cells infected with retroviruses encoding shBmi1, shE4f1, or an empty vector were fixed, permeabilized, and stained sequentially with primary antibodies (mouse anti-BMI1 and rabbit anti-E4F1) and the matched conjugated secondary antibodies (anti-mouse PE and anti-rabbit FITC) and then analyzed by flow cytometry. (E) Proliferation of NIH 3T3 cells infected with retrovirus encoding shBmi1, shE4f1, or both. For A and E, proliferation was measured in three independent experiments each resulting from newly infected and selected cellular populations assessed in duplicates within 6 d of infection. Data are given as means ± SD. Populations assessed in these experiments are polyclonal.
Figure 3.
Figure 3.
p19Arf/p53 is not required in Bmi1–E4f1 interaction. (A) K562 cells (INK4A/ARF−/−/p53−/−) were sequentially transduced with MSCV-p53-GFP (or appropriate empty vector) and MSCV-Neo-E4f1 (or corresponding empty vector). Cells were kept in G418-containing medium during 7 d and then plated in triplicate and counted 4 d later. Relative cell expansions were measured in two independent experiments each resulting from newly infected and selected cellular populations assessed in triplicates within 6 d of infection. Data are given as means ± SD. (B) NIH 3T3 cells (INK4A/ARF−/−/p53+) were sequentially transduced with MSCV-E6- GFP (or appropriate empty vector) and MSCV-Neo-E4f1 (or corresponding empty vector). Cells were kept in selective medium (containing G418 to prevent loss of E4f1 expressing retrovirus) during 7 d and then plated in triplicate and counted 4 d later. Relative proliferation rates were determined from two triplicate experiments (two independent infections). (C) BrdU incorporation assay in primary mouse embryonic fibroblasts (MEF) derived from p53+/+ or p53−/− E14.5 embryos and infected with combinations of control, shBmi1, and shE4f1 retroviruses. Cells were infected on day 3, and the BrdU pulse was 10 h. BrdU incorporation on day 6 after infection was measured in two independent experiments each resulting from newly infected and selected cellular populations assessed in triplicates within 6 d of infection. Data are given as means ± SD. (D) Whole cell protein extracts were prepared from control or E4f1-transduced NIH 3T3 cells at different time intervals (in hours) after exposure to a 5-Gy dose of ionizing radiation prior to Western blot analysis for E4F1, p21, and αTUBULIN (loading control).
Figure 4.
Figure 4.
Expression of E4f1 and Bmi1 in primitive hematopoietic cells. (A) Quantitative RT-PCR of Bmi1 and E4f1 in bone marrow (BM) hematopoietic cells: For each sorted cell population, mRNA levels were determined by calculating the ΔCt values where the levels of mRNA for Bmi1 and E4f1 are normalized according to the endogenous control gene GapdhCt = CttargetCtendogenous control). The graph shows ratios of 1/ΔCt. ΔCt values are shown in the table below. Experiments were repeated twice with bone marrow cells extracted from two series of >150 animals. Each Q-PCR reaction was performed in duplicate using automated pipette delivery systems (Biomek FX; Beckman). (B) Bmi1+/+ and Bmi1−/− fetal liver cells were cultured for 2 d, fixed, permeabilized, and analyzed by flow cytometry for BMI1 or E4F1 expression levels. (C) Bmi1+/+ and Bmi1−/− fetal liver cells were simultaneously stained with anti-Sca1, anti-BMI1, and anti-E4F1 antibodies. The histogram overlay showed E4F1 expression levels in the Sca1-negative population (hatched line) and the Sca1-positive population (red line). For B and C, FACS profiles are representatives from more than three independent experiments.
Figure 5.
Figure 5.
Loss of E4f1 rescues the proliferative defect of Bmi1 −/− hematopoietic progenitors. (A) Overview of the experimental strategy: Bmi1+/+ and Bmi1−/− fetal liver cells (the equivalent of one fetal liver) were infected for 2 d with GFP, Bmi1-GFP, or shE4f1-GFP retroviruses (at an efficiency of 80%–92%). The equivalent of one-half fetal liver was kept in culture for 10 d and assayed at different time points for their content in colony-forming cells (CFC). The equivalent of one-half fetal liver was transplanted in irradiated mice for in vivo study (see Fig. Fig. 6). (B) Bmi1+/+ and Bmi1−/− fetal liver cells engineered to express GFP or shE4f1-GFP retroviruses were visualized at day 4 of the culture under phase contrast microscopy (original magnification 20×). Representative of three independent experiments each with different fetal livers and retroviral preparations. (C) BrdU incorporation assay in primary FL cells. Cells were pulsed with BrdU for 24 h on day 4 after infection, and incorporation was measured in three independent experiments each resulting from newly infected cellular populations assessed in duplicates. Data are given as means ± SD. (D) The proportion of apoptotic cells was monitored by annexin V/PI staining. Representative of four independent experiments. (E) Bmi1−/− fetal liver cells engineered to express GFP, Bmi1-GFP, and shE4f1-GFP were assayed for senescence phenotype at day 6 of culture: The left panel showed representative flow cytometry analysis of p16Ink4a and p19Arf expression in transduced Bmi1−/− cells (gray-filled histograms) compared to GFP-transduced wild-type cells (dotted line histogram), and the right panel shows a representative SA-β-gal staining of transduced Bmi1−/− cells. Representative of two independent experiments each performed in triplicate. (F) Bmi1+/+ and Bmi1−/− fetal liver cells engineered to express GFP (ct, control), Bmi1-GFP, and shE4f1-GFP were assayed for their content in colony-forming cells (CFC) at different time of the culture. Results show means ± SD of four independent experiments performed in duplicate. (G) Frequency of colony type was evaluated after 4 d of culture by morphological (in toto) analysis and Wright staining of representative colonies. Representative of four independent experiments performed in duplicate.
Figure 6.
Figure 6.
Loss of E4f1 rescues the repopulating ability of Bmi1-deficient cells. (A) Two days after infection, Bmi1+/+ and Bmi1−/− fetal liver (the equivalent of one-half fetal liver) cells (Ly5.2) engineered to express GFP, Bmi1-GFP, or shE4f1-GFP were injected into lethally irradiated congenic (i.e., Ly5.1) recipient mice along with Ly5.1 competitor cells. Repopulation activity of the transduced cells was evaluated by monitoring donor cell chimerism (Ly5.2+ GFP+) in peripheral blood 4, 8, and 12 wk after transplantation. The figure shows representative FACS profiles from four recipients per group and n = 2 independent experiments (mean values for repopulation ±SD are indicated). (B) Proportions of shE4f1-GFP transduced Bmi1−/− cells in myeloid (Mac-1 and Gr1) and lymphoid (B220 and CD3) populations were determined at 12 wk post-transplantation. The data shown are representative FACS profiles from one recipient. Note that lympho-myeloid reconstitution was confirmed in all four mice analyzed (see A). (C) Representative FACS profile showing donor contribution (GFP+ Ly5.2+) at 22 wk post-transplantation in the peripheral blood of recipients of Bmi1−/− fetal liver cells engineered to express Bmi1-GFP, shE4f1-GFP, or Bmi1 mutants (ΔHTH-GFP and ΔPEST-GFP). Note that recipients for shE4f1 transduced cells are the same as used in A and B. Values are means ± SD of six recipients per group (for Bmi1 and the indicated mutants).

References

    1. Ahmed-Choudhury J., Agathanggelou A., Fenton S.L., Ricketts C., Clark G.J., Maher E.R., Latif F. Transcriptional regulation of cyclin A2 by RASSF1A through the enhanced binding of p120E4F to the cyclin A2 promoter. Cancer Res. 2005;65:2690–2697. - PubMed
    1. Benveniste P., Cantin C., Hyam D., Iscove N.N. Hematopoietic stem cells engraft in mice with absolute efficiency. Nat. Immunol. 2003;4:708–713. - PubMed
    1. Borden K.L., CampbellDwyer E.J., Carlile G.W., Djavani M., Salvato M.S. Two RING finger proteins, the oncoprotein PML and the arenavirus Z protein, colocalize with the nuclear fraction of the ribosomal P proteins. J. Virol. 1998;72:3819–3826. - PMC - PubMed
    1. Bruggeman S.W., Valk-Lingbeek M.E., van der Stoop P.P., Jacobs J.J., Kieboom K., Tanger E., Hulsman D., Leung C., Arsenijevic Y., Marino S., et al. Ink4a and Arf differentially affect cell proliferation and neural stem cell self-renewal in Bmi1-deficient mice. Genes & Dev. 2005;19:1438–1443. - PMC - PubMed
    1. Buchwald G., van der Stoop P., Weichenrieder O., Perrakis A., van Lohuizen M., Sixma T.K. Structure and E3-ligase activity of the Ring–Ring complex of Polycomb proteins Bmi1 and Ring1b. EMBO J. 2006;25:2465–2474. - PMC - PubMed

Publication types

MeSH terms