

Noise in transcription negative feedback loops: simulation and experimental analysis
- PMID: 16883354
- PMCID: PMC1681513
- DOI: 10.1038/msb4100081
Noise in transcription negative feedback loops: simulation and experimental analysis
Abstract
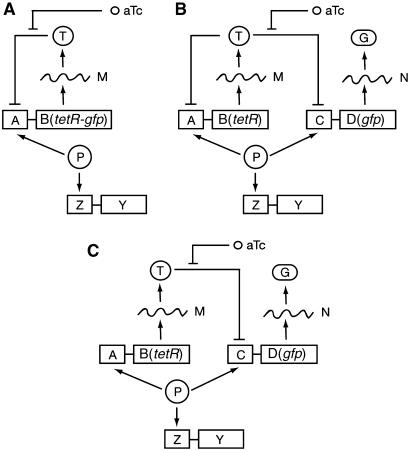
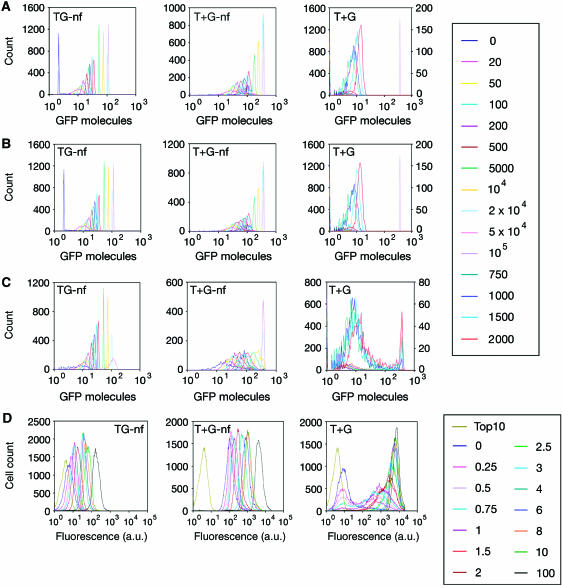
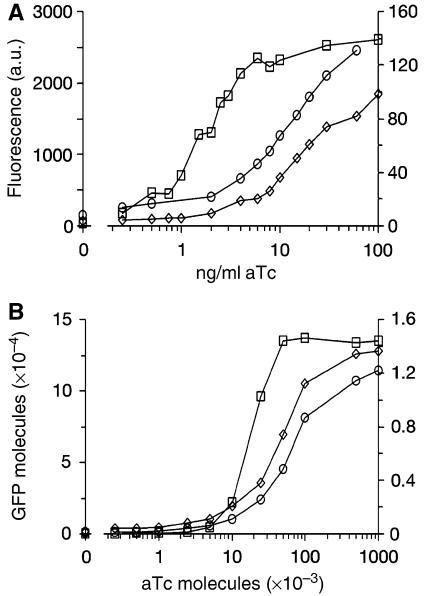
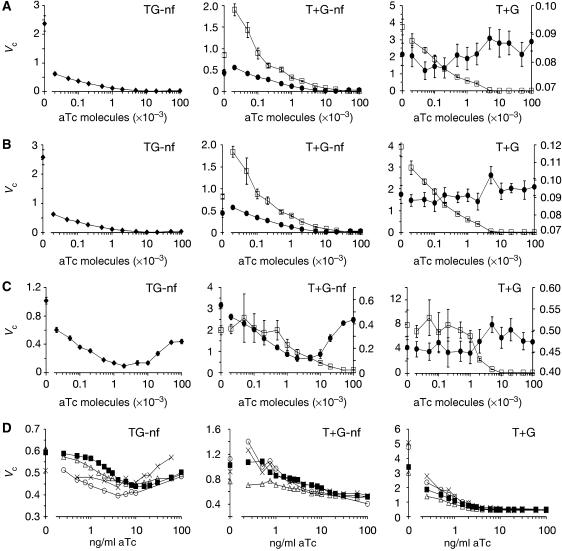
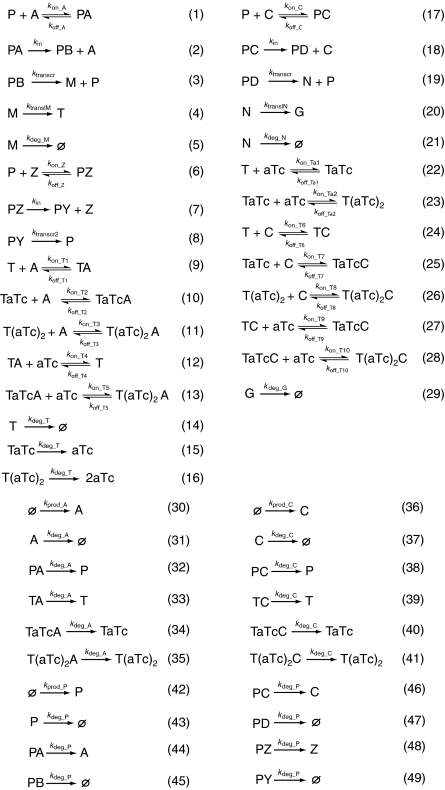
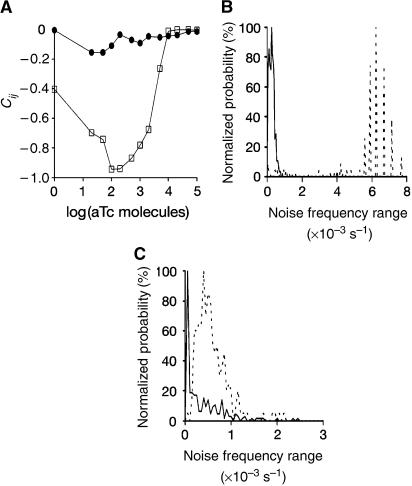
Negative feedback loops have been invoked as a way to control and decrease transcriptional noise. Here, we have built three circuits to test the effect of negative feedback loops on transcriptional noise of an autoregulated gene encoding a transcription factor (TF) and a downstream gene (DG), regulated by this TF. Experimental analysis shows that self-repression decreases noise compared to expression from a non-regulated promoter. Interestingly enough, we find that noise minimization by negative feedback loop is optimal within a range of repression strength. Repression values outside this range result in noise increase producing a U-shaped behaviour. This behaviour is the result of external noise probably arising from plasmid fluctuations as shown by simulation of the network. Regarding the target gene of a self-repressed TF (sTF), we find a strong decrease of noise when repression by the sTF is strong and a higher degree of noise anti-correlation between sTF and its target. Simulations of the circuits indicate that the main source of noise in these circuits could come from plasmid variation and therefore that negative feedback loops play an important role in suppressing both external and internal noise. An important observation is that DG expression without negative feedback exhibits bimodality at intermediate TF repression values. This bimodal behaviour seems to be the result of external noise as it can only be found in those simulations that include plasmid variation.
Figures
Similar articles
-
Modeling feedback loops in the H-NS-mediated regulation of the Escherichia coli bgl operon.J Theor Biol. 2008 Jan 21;250(2):298-306. doi: 10.1016/j.jtbi.2007.09.033. Epub 2007 Nov 5. J Theor Biol. 2008. PMID: 17981304
-
Transcription and noise in negative feedback loops.Biosystems. 2008 Jan;91(1):76-82. doi: 10.1016/j.biosystems.2007.08.001. Epub 2007 Aug 19. Biosystems. 2008. PMID: 17884282
-
Nonlatching positive feedback enables robust bimodality by decoupling expression noise from the mean.PLoS Biol. 2017 Oct 18;15(10):e2000841. doi: 10.1371/journal.pbio.2000841. eCollection 2017 Oct. PLoS Biol. 2017. PMID: 29045398 Free PMC article.
-
Synthetic mammalian transgene negative autoregulation.Mol Syst Biol. 2013 Jun 4;9:670. doi: 10.1038/msb.2013.27. Mol Syst Biol. 2013. PMID: 23736683 Free PMC article.
-
Distinct noise-controlling roles of multiple negative feedback mechanisms in a prokaryotic operon system.IET Syst Biol. 2011 Mar;5(2):145-56. doi: 10.1049/iet-syb.2010.0020. IET Syst Biol. 2011. PMID: 21405203
Cited by
-
Synthetic approaches to study transcriptional networks and noise in mammalian systems.IET Syst Biol. 2013 Feb;7(1):11-7. doi: 10.1049/iet-syb.2012.0026. IET Syst Biol. 2013. PMID: 23848051 Free PMC article.
-
The negative feedback-loop between the oncomir Mir-24-1 and menin modulates the Men1 tumorigenesis by mimicking the "Knudson's second hit".PLoS One. 2012;7(6):e39767. doi: 10.1371/journal.pone.0039767. Epub 2012 Jun 27. PLoS One. 2012. PMID: 22761894 Free PMC article.
-
The Systems Biology of Single-Cell Aging.iScience. 2018 Sep 28;7:154-169. doi: 10.1016/j.isci.2018.08.023. Epub 2018 Sep 3. iScience. 2018. PMID: 30267677 Free PMC article. Review.
-
Negative auto-regulation increases the input dynamic-range of the arabinose system of Escherichia coli.BMC Syst Biol. 2011 Jul 12;5:111. doi: 10.1186/1752-0509-5-111. BMC Syst Biol. 2011. PMID: 21749723 Free PMC article.
-
A Regulatory Network Controls cabABC Expression Leading to Biofilm and Rugose Colony Development in Vibrio vulnificus.Front Microbiol. 2020 Jan 17;10:3063. doi: 10.3389/fmicb.2019.03063. eCollection 2019. Front Microbiol. 2020. PMID: 32010109 Free PMC article.
References
-
- Ander M, Beltrao P, Di Ventura B, Ferkinghoff-Borg J, Foglierini M, Kaplan A, Lemerle C, Tomas-Oliveira I, Serrano L (2004) SmartCell, a framework to simulate cellular processes that combines stochastic approximation with diffusion and localisation: analysis of simple networks. Systems Biol 1: 129–138 - PubMed
-
- Austin DW, Allen MS, McCollum JM, Dar RD, Wilgus JR, Sayler GS, Samatova NF, Cox CD, Simpson ML (2006) Gene network shaping of inherent noise spectra. Nature 439: 608–611 - PubMed
-
- Backes H, Berens C, Helbl V, Walter S, Schmid FX, Hillen W (1997) Combinations of the alpha-helix-turn-alpha-helix motif of TetR with respective residues from LacI or 434Cro: DNA recognition, inducer binding, and urea-dependent denaturation. Biochemistry 36: 5311–5322 - PubMed
-
- Becskei A, Serrano L (2000) Engineering stability in gene networks by autoregulation. Nature 405: 590–593 - PubMed
Publication types
MeSH terms
Substances
LinkOut - more resources
Full Text Sources
Miscellaneous
