. 2006 Aug 2;26(31):8092-100.
doi: 10.1523/JNEUROSCI.2181-06.2006.

Adenosine and sleep homeostasis in the Basal forebrain

Affiliations

Adenosine and sleep homeostasis in the Basal forebrain

Carlos Blanco-Centurion et al. J Neurosci. .

Abstract

It is currently hypothesized that the drive to sleep is determined by the activity of the basal forebrain (BF) cholinergic neurons, which release adenosine (AD), perhaps because of increased metabolic activity associated with the neuronal discharge during waking, and the accumulating AD begins to inhibit these neurons so that sleep-active neurons can become active. This hypothesis grew from the observation that AD induces sleep and AD levels increase with wake in the basal forebrain, but surprisingly it still remains untested. Here we directly test whether the basal forebrain cholinergic neurons are central to the AD regulation of sleep drive by administering 192-IgG-saporin to lesion the BF cholinergic neurons and then measuring AD levels in the BF. In rats with 95% lesion of the BF cholinergic neurons, AD levels in the BF did not increase with 6 h of prolonged waking. However, the lesioned rats had intact sleep drive after 6 and 12 h of prolonged waking, indicating that the AD accumulation in the BF is not necessary for sleep drive. Next we determined that, in the absence of the BF cholinergic neurons, the selective adenosine A1 receptor agonist N6-cyclohexyladenosine, administered to the BF, continued to be effective in inducing sleep, indicating that the BF cholinergic neurons are not essential to sleep induction. Thus, neither the activity of the BF cholinergic neurons nor the accumulation of AD in the BF during wake is necessary for sleep drive.


Figures

Figure 1.
Figure 1.
Localization of the microdialysis probe in the basal forebrain. A is a schematic figure from the rat brain atlas of Paxinos and Watson (2006), and the location of the microdialysis probe is depicted by a small black rectangle. The larger rectangle represents the area depicted by the photomicrographs in B and C. B, Photomicrograph of the track of the microdialysis probe in the basal forebrain of a representative saline control rat with the tip of the probe surrounded by cholinergic neurons. C, Photomicrograph of the track in a representative rat administered 192-IgG-Sap, which kills the BF cholinergic neurons. AC, Anterior commissure; CPu, caudate–putamen; OT, optic tract. Scale bar, 200 μm.
Figure 2.
Figure 2.
Adenosine levels in the basal forebrain during 6 h of total sleep deprivation (TSD). Adenosine levels (mean ± SEM) in the basal forebrain in saline control rats and rats administered 192-IgG-Sap to lesion the basal forebrain cholinergic neurons. AD was collected from the basal forebrain using microdialysis methods and measured via HPLC analysis. Samples (15 μl total volume collected) from the basal forebrain were collected at the start of the hour. Samples were collected for the 1 h before the start of the sleep deprivation and at each hour during the sleep deprivation. The data during the sleep deprivation period was averaged into 2 h blocks. *p < 0.001, significant difference compared with pre-total sleep deprivation; **p < 0.002, significant difference compared with the saline group.
Figure 3.
Figure 3.
Changes in sleep in response to 6 and 12 h of total sleep deprivation (TSD). Each data point represents the average ± SEM cumulative change in total sleep time, non-REM sleep, and REM sleep during 6 h (left) and 12 h (right) of TSD and the recovery sleep period. To calculate the cumulative change, hourly amounts of non-REM and REM sleep on the baseline day were subtracted from those on the sleep deprivation day, resulting in a cumulative deficit by the 6th and 12th hours of sleep deprivation. The cumulative deficit was then tallied over the recovery period. There were no significant differences in the rate of the sleep deficit, and both groups recovered from the deficit at the same rate.
Figure 4.
Figure 4.
EEG delta power (EEG 0.3–4 Hz) during recovery sleep after 6 h of total sleep deprivation. The delta power was determined in non-REM sleep during baseline and recovery sleep, and each data point represents the average difference from baseline (0 line on the y-axis). Delta power, a measure of sleep drive, was highest in both groups during the first hour of recovery sleep and then progressively declined to baseline levels. *p < 0.05, significant difference compared with baseline.
Figure 5.
Figure 5.
Time to onset of non-REM and REM sleep after 20 min periods of wake. Two hours after the start of the lights-on cycle, rats were kept awake for 20 min and then allowed to sleep for 20 min. This alternating regimen of 20 min wake and 20 min sleep periods was continued throughout the lights-on period. The graph summarizes the time to onset of non-REM and REM sleep during the 20 min sleep periods. There were no significant differences between the control and 192-IgG-Sap groups.
Figure 6.
Figure 6.
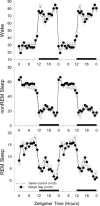
Sleep–wake states after 192-IgG-Sap lesions. Mean ± SEM percentage of wake, non-REM sleep, and REM sleep in saline-treated and 192-IgG-Sap-treated rats that had 95% loss of the BF cholinergic neurons. Two weeks after administration of 192-IgG-Sap, sleep was recorded over a continuous 48 h period, and the data were averaged hourly to yield a 24 h plot. The 24 h data are double plotted to better reveal the diurnal rhythm of the sleep–wake cycle. The black bar represents the 12 h lights-off period. There were no significant differences between the two groups.
Figure 7.
Figure 7.
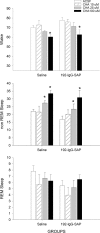
Effects of the adenosine A1 receptor agonist CHA on wake, non-REM sleep, and REM sleep. Different concentrations of CHA (10, 25, and 100 μm) or aCSF were infused via microdialysis into the basal forebrain for 12 h at the start of the lights-off period, and sleep was recorded during the drug infusion period. Data represent the mean ± SEM percentage of wake, non-REM sleep, and REM sleep in saline- and 192-IgG-Sap-treated rats that had 95% loss of the BF cholinergic neurons. *p < 0.05, significant difference compared with the respective aCSF of each group. The sample size for the saline group was as follows: aCSF, n = 9; CHA at 10 μm, n = 7; CHA at 25 μm, n = 9; CHA at 100 μm, n = 9. The sample size for the 192-IgG-Sap group was as follows: aCSF, n = 12; CHA at 10 μm, n = 5; CHA at 25 μm, n = 12; CHA at 100 μm, n = 12.

Similar articles

Cited by

References

    1. Alanko L, Heiskanen S, Stenberg D, Porkka-Heiskanen T (2003). Adenosine kinase and 5′-nucleotidase activity after prolonged wakefulness in the cortex and the basal forebrain of rat. Neurochem Int 42:449–454. - PubMed
    1. Basheer R, Arrigoni E, Thatte HS, Greene RW, Ambudkar IS, McCarley RW (2002). Adenosine induces inositol 1,4,5-trisphosphate receptor-mediated mobilization of intracellular calcium stores in basal forebrain cholinergic neurons. J Neurosci 22:7680–7686. - PMC - PubMed
    1. Bassant MH, Apartis E, Jazat-Poindessous FR, Wiley RG, Lamour YA (1995). Selective immunolesion of the basal forebrain cholinergic neurons: effects on hippocampal activity during sleep and wakefulness in the rat. Neurodegeneration 4:61–70. - PubMed
    1. Book AA, Wiley RG, Schweitzer JB (1994). 192 IgG-saporin. I. Specific lethality for cholinergic neurons in the basal forebrain of the rat. J Neuropathol Exp Neurol 53:95–102. - PubMed
    1. Borbely AA, Tobler I, Hanagasioglu M (1984). Effect of sleep deprivation on sleep and EEG power spectra in the rat. Behav Brain Res 14:171–182. - PubMed

Publication types

LinkOut - more resources