Impact of protists on the activity and structure of the bacterial community in a rice field soil
- PMID: 16885296
- PMCID: PMC1538762
- DOI: 10.1128/AEM.00207-06
Impact of protists on the activity and structure of the bacterial community in a rice field soil
Abstract
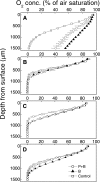
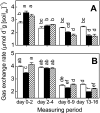
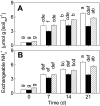
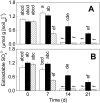
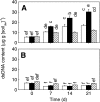
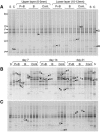
Flooded rice fields have become a model system for the study of soil microbial ecology. In Italian rice fields, in particular, aspects from biogeochemistry to molecular ecology have been studied, but the impact of protistan grazing on the structure and function of the prokaryotic community has not been examined yet. We compared an untreated control soil with a gamma-radiation-sterilized soil that had been reinoculated with a natural bacterial assemblage. In order to verify that the observed effects were due to protistan grazing and did not result from sterilization, we set up a third set of microcosms containing sterilized soil that had been reinoculated with natural assemblage bacteria plus protists. The spatial and temporal changes in the protistan and prokaryotic communities were examined by denaturing gradient gel electrophoresis (DGGE) and terminal restriction fragment length polymorphism (T-RFLP) analysis, respectively, both based on the small-subunit gene. Sequences retrieved from DGGE bands were preferentially affiliated with Cercozoa and other bacteriovorous flagellates. Without protists, the level of total DNA increased with incubation time, indicating that the level of the microbial biomass was elevated. Betaproteobacteria were preferentially preyed upon, while low-G + C-content gram-positive bacteria became more dominant under grazing pressure. The bacterial diversity detectable by T-RFLP analysis was greater in the presence of protists. The level of extractable NH4+ was lower and the level of extractable SO4(2-) was higher without protists, indicating that nitrogen mineralization and SO4(2-) reduction were stimulated by protists. Most of these effects were more obvious in the partially oxic surface layer (0 to 3 mm), but they could also be detected in the anoxic subsurface layer (10 to 13 mm). Our observations fit well into the overall framework developed for protistan grazing, but with some modifications pertinent to the wetland situation: O2 was a major control, and O2 availability may have limited directly and indirectly the development of protists. Although detectable in the lower anoxic layer, grazing effects were much more obvious in the partially oxic surface layer.
Figures

References
-
- Alphei, J., M. Bonkowski, and S. Scheu. 1996. Protozoa, Nematoda and Lumbricidae in the rhizosphere of Hordelymus europaeus (Poaceae)—faunal interactions, response of microorganisms and effects on plant growth. Oecologia 106:111-126. - PubMed
-
- Alphei, J., and S. Scheu. 1993. Effects of biocidal treatments on biological and nutritional properties of a mull-structured woodland soil. Geoderma 56:435-445.
-
- Anderson, R. V., E. T. Elliott, J. F. Mcclellan, D. C. Coleman, C. V. Cole, and H. W. Hunt. 1978. Trophic interactions in soils as they affect energy and nutrient dynamics. 3. Biotic interactions of bacteria, amebas, and nematodes. Microb. Ecol. 4:361-371. - PubMed
-
- Badalucco, L., F. Pomare, S. Grego, L. Landi, and P. Nannipieri. 1994. Activity and degradation of streptomycin and cycloheximide in soil. Biol. Fertil. Soils 18:334-340.
-
- Bak, F., G. Scheff, and K. H. Jansen. 1991. A rapid and sensitive ion chromatographic technique for the determination of sulfate and sulfate reduction rates in freshwater lake sediments. FEMS Microbiol. Ecol. 85:23-30.
Publication types
MeSH terms
Substances
Associated data
- Actions
- Actions
- Actions
- Actions
- Actions
- Actions
- Actions
- Actions
- Actions
- Actions
- Actions
- Actions
- Actions
- Actions
- Actions
- Actions
- Actions
- Actions
- Actions
- Actions
- Actions
- Actions
- Actions
- Actions
- Actions
- Actions
- Actions
- Actions
- Actions
- Actions
- Actions
- Actions
- Actions
- Actions
- Actions
- Actions
- Actions
- Actions
- Actions
- Actions
- Actions
- Actions
- Actions
- Actions
- Actions
- Actions
- Actions
- Actions
- Actions
- Actions
- Actions
- Actions
- Actions
- Actions
- Actions
- Actions
- Actions
- Actions
- Actions
- Actions
- Actions
- Actions
- Actions
- Actions
- Actions
- Actions
- Actions
- Actions
- Actions
- Actions
- Actions
- Actions
- Actions
LinkOut - more resources
Full Text Sources
Molecular Biology Databases

