. 2006 Aug;188(16):5935-44.
doi: 10.1128/JB.00235-06.

Cyclic AMP-dependent osmoregulation of crp gene expression in Escherichia coli

Affiliations

Cyclic AMP-dependent osmoregulation of crp gene expression in Escherichia coli

Carlos Balsalobre et al. J Bacteriol. 2006 Aug.

Abstract

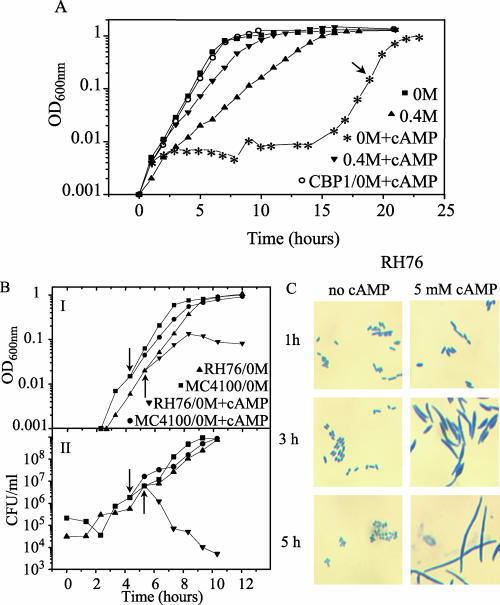
We have found that the cyclic AMP (cAMP) receptor protein (CRP)-cAMP regulatory complex in Escherichia coli is subject to osmoregulation at the level of crp gene expression. This osmoregulation was lost in a cya mutant strain but could be restored by external addition of cAMP, suggesting that the intracellular level of cAMP is a key factor in the osmoregulation of CRP. The ability of the cell to maintain optimal CRP activity was essential for the growth and survival of the bacteria under low-osmolarity conditions as shown by studies with different crp mutant alleles. A suppressor mutant with a novel amino acid substitution (L124R) in CRP showed restored growth at low osmolarity. CRP(L124R) was not activated by cAMP and was shown to be dominant negative over the wild type. Our findings suggest that the fine-tuning of the CRP activity may be critical for bacterial viability and adaptability to changing osmotic conditions.


Figures

FIG. 1.
FIG. 1.
Effect of osmolarity on CRP expression and crp gene transcription. A. Immunodetection of CRP in cultures of E. coli strain MC4100 growing in the absence or presence of 400 mM NaCl. As a control, immunodetection of EIIA is shown. B. The level of CRP was monitored by Western blotting in strain MC4100 growing in rich MOPS without NaCl in the presence (+) and in the absence (−) of either 30% sucrose (upper panel) or 0.7 M glycerol (lower panel). C. RNA samples from cultures of E. coli strain MC4100 grown in the absence or presence of 400 mM NaCl were analyzed by Northern blotting. As a control, ethidium bromide-stained bands corresponding to the 16S and 23S rRNAs are shown.
FIG. 2.
FIG. 2.
A. Quantitative determinations of CRP content by Western blotting analysis of strain MG1655. The cells were grown in rich MOPS supplemented with either 0.5% glycerol or 0.4% glucose and the indicated concentrations of NaCl. The relative amount of CRP was obtained by dividing each value by the value obtained from the culture growing in the presence of glycerol in the absence of NaCl (arbitrarily set to 1). Data shown are from one of two separate experiments that gave similar results. B. Effect of the external osmolarity on lacZ expression. The cells were grown in rich MOPS supplemented with either 0.5% glycerol or 0.4% glucose and the indicated concentrations of NaCl. IPTG was added to a final concentration of 0.5 mM in the cultures of strain MG1655. At mid-log phase, samples were taken for β-galactosidase activity measurements. C. Generation times and total protein content of strains MG1655 and MC4100 during exponential phase. The strains were grown in rich MOPS supplemented with 0.4% glucose and containing either 0 or 400 mM of NaCl. Total protein content was determined at mid-log phase.
FIG. 3.
FIG. 3.
A. Effect of the addition of cAMP on lacZ expression. The MG1655 strain was grown in rich MOPS supplemented with glucose (0.4%) and containing 0 (squares) or 400 (triangles) mM NaCl. IPTG was added to a final concentration of 0.5 mM in the cultures of strain MG1655. At an OD600 of about 0.15, cAMP (5 mM) was added and samples were taken for the determination of the β-galactosidase activity at different time points. The different values were divided by the values before the addition of cAMP (arbitrarily set to 1.0). The relative value of 1 corresponds to 471 Miller units in the absence of NaCl and to 1,011 Miller units in cultures with 400 mM of NaCl. B. Effect of addition of cAMP on lacZ expression of the lacI strain CSH140. The experiment was performed as described for panel A. The relative value of 1 corresponds to 1,050 Miller units in the absence of NaCl and 3,233 Miller units in cultures with 400 mM of NaCl. C and D. Effect of the addition of cAMP on lacUV5 and lacZ expression. Strains RLG4998 (C) and MG1655 (D) were grown in rich MOPS supplemented with glucose (0.4%) and containing 0 (squares) or 400 (triangles) mM NaCl at 30°C. IPTG was added to a final concentration of 0.5 mM in the cultures of strain MG1655. At an OD600 of about 0.15, cAMP (5 mM) was added and samples were taken for the determination of the β-galactosidase activity at different time points. The different values were divided by the values before the addition of cAMP (arbitrarily set to 1.0). For strain RLG4998, the relative value of 1 corresponds to 1,559 Miller units in the absence of NaCl and to 1,278 Miller units in cultures with 400 mM of NaCl. For strain MG1655, the relative value of 1 corresponds to 773 Miller units in the absence of NaCl and to 995 Miller units in cultures with 400 mM of NaCl. E. Effect of the osmolarity on the cAMP levels in E. coli cultures growing in rich MOPS supplemented with glucose in the absence or presence of 400 mM NaCl at 37°C. The results represent the averages ± standard errors of three independent experiments.
FIG. 4.
FIG. 4.
Osmoregulation of CRP is lost in a strain lacking cya. Strains MC4100 (wt) and RH76 (cya) were grown in rich MOPS medium containing either 0 or 400 mM NaCl without or with cAMP (5 mM). At mid-log phase, the cells were harvested and CRP was detected by Western blotting analysis (bottom panel). Quantitative determination of CRP was performed (top panel); the results shown are the averages of three experiments. The relative amount of CRP was obtained by dividing each value with the value for the MC4100 strain growing at low osmolarity without cAMP (arbitrarily set to 1.0). The asterisk shows that no CRP quantification was performed for strain RH76 cultured at low osmolarity with added cAMP since no growth was detected (see text for further details).
FIG. 5.
FIG. 5.
Growth-inhibitory effect of the addition of external cAMP and isolation of a suppressor mutant with restored growth ability. A. Growth curves of strain RH76 (cya) growing in rich MOPS supplemented with glucose either in the absence or in the presence of 0.4 M of NaCl and/or 5 mM cAMP. The arrow indicates the time point from which CBP1 was isolated. B. Strains MC4100 and RH76 (cya) were grown in rich MOPS supplemented with glucose in the absence of NaCl. At a cell density of about an OD600 of 0.15 (indicated by arrows), cAMP was added to a final concentration of 5 mM. The growth was monitored by determination of the OD600 (I) as well as the number of viable bacteria (CFU/ml) (II). C. Cell morphology of strain RH76. The samples were taken 1, 3, and 5 h after the cultures were divided into a portion without cAMP and a portion with cAMP.
FIG. 6.
FIG. 6.
Characterization of the mutant strain CBP1. A. CRP is shown as a horizontal bar representing amino acids 1 to 209. The cAMP binding domain and the DNA binding domain are indicated by arrows, and the α-helix domains (A to F) are shown by open boxes (3). The amino acid sequence of the region where the substitution was detected in the mutant crp(L124R) is shown at the bottom. B. Effect of the presence of different crp alleles on the growth in rich MOPS under low-osmolarity conditions in the presence or absence of cAMP (5 mM). Cultures were monitored after 7 h of incubation. +, growth; −, no growth; n.d., not determined. C. Generation time in minutes of strains RH76, CBP1, and CBP2 growing in rich MOPS under the conditions indicated. D. Western immunoblot analyses of the CRP levels in the different strains. E. β-Galactosidase activity in strains CBP3 and CBP4 growing either in LB or in rich MOPS medium in the absence of NaCl, containing IPTG, up to an OD600 of 0.25. Importantly, cAMP was then added at the indicated concentrations and β-galactosidase activity was measured after 1 hour. F. Effect of the presence of different crp alleles on the expression of the maltose regulon. The different strains were grown on maltose-MacConkey agar plates. Bacterial phenotype was scored after overnight growth on plates at 37°C.
FIG. 7.
FIG. 7.
Model of osmoregulation of crp. Green arrows designate activation whereas red arrows designate repression. See Discussion for further details.

Similar articles

Cited by

References

    1. Aiba, H. 1983. Autoregulation of the Escherichia coli crp gene: CRP is a transcriptional repressor for its own gene. Cell 32:141-149. - PubMed
    1. Aiba, H. 1985. Transcription of the Escherichia coli adenylate cyclase gene is negatively regulated by cAMP-cAMP receptor protein. J. Biol. Chem. 260:3063-3070. - PubMed
    1. Aiba, H., T. Nakamura, H. Mitani, and H. Mori. 1985. Mutations that alter the allosteric nature of cAMP receptor protein of Escherichia coli. EMBO J. 4:3329-3332. - PMC - PubMed
    1. Baga, M., M. Goransson, S. Normark, and B. E. Uhlin. 1988. Processed mRNA with differential stability in the regulation of E. coli pilin gene expression. Cell 52:197-206. - PubMed
    1. Balsalobre, C., J. Johansson, B. E. Uhlin, A. Juarez, and F. J. Munoa. 1999. Alterations in protein expression caused by the hha mutation in Escherichia coli: influence of growth medium osmolarity. J. Bacteriol. 181:3018-3024. - PMC - PubMed

Publication types

MeSH terms

LinkOut - more resources