Review
. 2006 Oct;5(10):1727-44.
doi: 10.1074/mcp.M600162-MCP200. Epub 2006 Aug 3.

Advances and challenges in liquid chromatography-mass spectrometry-based proteomics profiling for clinical applications

Affiliations
Review

Advances and challenges in liquid chromatography-mass spectrometry-based proteomics profiling for clinical applications

Wei-Jun Qian et al. Mol Cell Proteomics. 2006 Oct.

Abstract

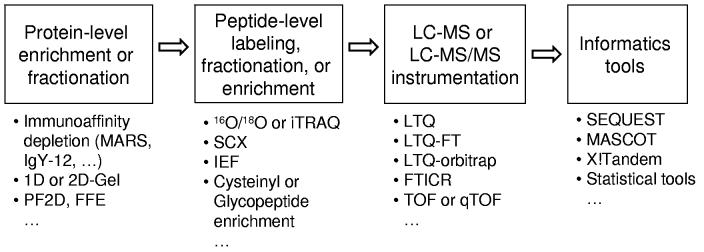
Recent advances in proteomics technologies provide tremendous opportunities for biomarker-related clinical applications; however, the distinctive characteristics of human biofluids such as the high dynamic range in protein abundances and extreme complexity of the proteomes present tremendous challenges. In this review we summarize recent advances in LC-MS-based proteomics profiling and its applications in clinical proteomics as well as discuss the major challenges associated with implementing these technologies for more effective candidate biomarker discovery. Developments in immunoaffinity depletion and various fractionation approaches in combination with substantial improvements in LC-MS platforms have enabled the plasma proteome to be profiled with considerably greater dynamic range of coverage, allowing many proteins at low ng/ml levels to be confidently identified. Despite these significant advances and efforts, major challenges associated with the dynamic range of measurements and extent of proteome coverage, confidence of peptide/protein identifications, quantitation accuracy, analysis throughput, and the robustness of present instrumentation must be addressed before a proteomics profiling platform suitable for efficient clinical applications can be routinely implemented.


Figures

Figure 1
Figure 1
A component diagram of a LC-MS protein profiling platform.
Figure 2
Figure 2
A typical LC-FTICR analysis of an IgY-12 depleted human plasma sample. (A) The base peak chromatogram. (B) A 2D-display of ∼2800 identified species at the mass and normalized elution time (NET) space. The analysis was performed using a Bruker 9.4 Tesla FTICR instrument coupled with an LC system equipped with a 150 μm i.d. and 65 cm long capillary column operated at 5000 psi.
Figure 3
Figure 3
Schematic representation of a chemical fractionation strategy applied to the plasma proteome characterization. High abundance proteins were firstly removed using immunoaffinity subtraction. The resulting less-abundant proteins were split and subjected to solid-phase cysteinyl peptide and N-glycoprotein captures, independently. Noncysteinyl peptides and non-glycopeptides generated at the same time were also collected. All 4 different peptide populations were then fractionated by SCX chromatography and each fraction was analyzed by capillary LC-MS/MS.
Figure 4
Figure 4
Schematic diagram of a prototype ESI-IMS-QTOF instrumentation platform that uses electrodynamic ion funnel interfaces at both ends of the IMS drift tube, and as a result, provides very high sensitivity from high speed analyses.
Figure 5
Figure 5
Relative frequency of different peptides identified from the normal human protein database (solid line) and the reversed human protein database (dashed line) at different Xcorr values. Data shown are for the 2+ charge state fully tryptic peptides identified from human plasma and filtered with ΔCn ≥ 0.1.
Figure 6
Figure 6
(A) Mass error histograms of features detected from a single LC-FTICR dataset of a human plasma sample that matched to a human plasma AMT tag database using different levels of normalized elution time (NET) constraints. The LC separation time is normalized to a 0-1 scale in NET. (B) Mass error histograms for features from the same dataset matching to a normal AMT tag database (magenta curve) and to a shifted AMT tag database (blue curve). Blue squares represent random matches to the 11 Da shifted AMT tag database.
Figure 7
Figure 7
(A) A partial 2D display of the detected 18O/16O labeled peptide pairs from a LC-FTICR analysis. The elution time is shown as a normalized scale between 0 and 1. Observed peaks (represented by spots) correspond to various eluting peptides. The heavy and light isotope-labeled pairs are easily visualized with a 4 Da mass difference. (B) Normalized fold changes for the 429 quantified proteins following LPS administration. Abundance ratio for each protein shown was normalized to zero (R – 1). For ratios smaller than 1, normalized inverted ratios were calculated as [1 – (1/R)]. Error bar for each protein indicates the standard deviation for the abundance ratios from multiple peptides. Proteins without error bars were identified with single peptides.
Figure 8
Figure 8
Pearson correlation plot comparing peptide intensities of LC-FTICR analyses of plasma samples. (A) Nine technical replicates for a pooled reference plasma sample from multiple healthy subjects. (B) Nine human plasma samples from individual healthy subjects with ages range from 18-26. (C) Nine mouse plasma samples isolated from individual C57BL6 mice. Each sample including the technical replicate was separately processed by ProteomeLab™ IgY-12 (for human) or IgY-R7 (for mouse) depletion and the flow-through portions were digested with trypsin prior to LC-MS analyses.

References

    1. Aebersold R, Mann M. Mass spectrometry-based proteomics. Nature. 2003;422:198–207. - PubMed
    1. Hanash S. Disease proteomics. Nature. 2003;422:226–232. - PubMed
    1. Etzioni R, Urban N, Ramsey S, McIntosh M, Schwartz S, Reid B, Radich J, Anderson G, Hartwell L. The case for early detection. Nat Rev Cancer. 2003;3:243–252. - PubMed
    1. Ludwig JA, Weinstein JN. Biomarkers in cancer staging, prognosis and treatment selection. Nat Rev Cancer. 2005;5:845–856. - PubMed
    1. Anderson NL, Anderson NG. The human plasma proteome: history, character, and diagnostic prospects. Mol. Cell. Proteomics. 2002;1:845–867. - PubMed

Publication types