

Incidence and lifetime costs of injuries in the United States
- PMID: 16887941
- PMCID: PMC2586784
- DOI: 10.1136/ip.2005.010983
Incidence and lifetime costs of injuries in the United States
Abstract
Background: Standardized methodologies for assessing economic burden of injury at the national or international level do not exist.
Objective: To measure national incidence, medical costs, and productivity losses of medically treated injuries using the most recent data available in the United States, as a case study for similarly developed countries undertaking economic burden analyses.
Method: The authors combined several data sets to estimate the incidence of fatal and non-fatal injuries in 2000. They computed unit medical and productivity costs and multiplied these costs by corresponding incidence estimates to yield total lifetime costs of injuries occurring in 2000.
Main outcome measures: Incidence, medical costs, productivity losses, and total costs for injuries stratified by age group, sex, and mechanism.
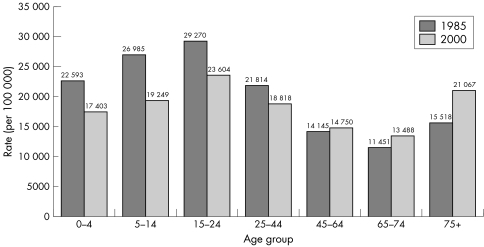
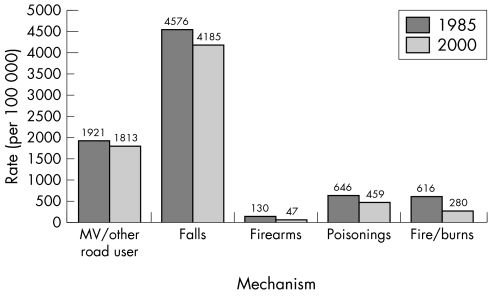
Results: More than 50 million Americans experienced a medically treated injury in 2000, resulting in lifetime costs of 406 billion dollars; 80 billion dollars for medical treatment and 326 billion dollars for lost productivity. Males had a 20% higher rate of injury than females. Injuries resulting from falls or being struck by/against an object accounted for more than 44% of injuries. The rate of medically treated injuries declined by 15% from 1985 to 2000 in the US. For those aged 0-44, the incidence rate of injuries declined by more than 20%; while persons aged 75 and older experienced a 20% increase.
Conclusions: These national burden estimates provide unequivocal evidence of the large health and financial burden of injuries. This study can serve as a template for other countries or be used in intercountry comparisons.
Republished in
-
Incidence and lifetime costs of injuries in the United States.Inj Prev. 2015 Dec;21(6):434-40. doi: 10.1136/ip.2005.010983rep. Inj Prev. 2015. PMID: 26609059
Comment in
-
Communicating consequences with costs: a commentary on Corso et al's cost of injury.Inj Prev. 2015 Dec;21(6):432-3. doi: 10.1136/injuryprev-2015-041862. Epub 2015 Oct 26. Inj Prev. 2015. PMID: 26503285 No abstract available.
References
-
- Peden M, McGee K, Krug E. eds. Injury: A leading cause of the burden of disease, 2000. Geneva: The World Health Organization, 2002
-
- EMC (Erasmus Medical Center) and CSI (Consumer Safety Institute) A surveillance based assessment of medical costs of injury in Europe: Phase 2. Final Report. Rotterdam and Amsterdam: EMC and CSI, 2004
-
- Bowman B. Towards a South African injury costing model. A review of the literature for the development of a process path. African Safety Promotion 2002155–64.
-
- TRL (Transport Research Laboratory) Costing road accidents in developing countries. Overseas Road Note 10. Crowthorne: TRL, 1995
-
- Rice D, MacKenzie E, and Associates Cost of injury in the United States: A report to Congress. San Francisco, CA: Institute for Health & Aging, University of California and Injury Prevention Center, The Johns Hopkins University, 1989
MeSH terms
LinkOut - more resources
Full Text Sources
Medical