. 2006 Oct;80(4):905-14.
doi: 10.1189/jlb.1105649. Epub 2006 Aug 3.

Identification and characterization of a human monoclonal antagonistic antibody AL-57 that preferentially binds the high-affinity form of lymphocyte function-associated antigen-1

Affiliations

Identification and characterization of a human monoclonal antagonistic antibody AL-57 that preferentially binds the high-affinity form of lymphocyte function-associated antigen-1

Lili Huang et al. J Leukoc Biol. 2006 Oct.

Abstract

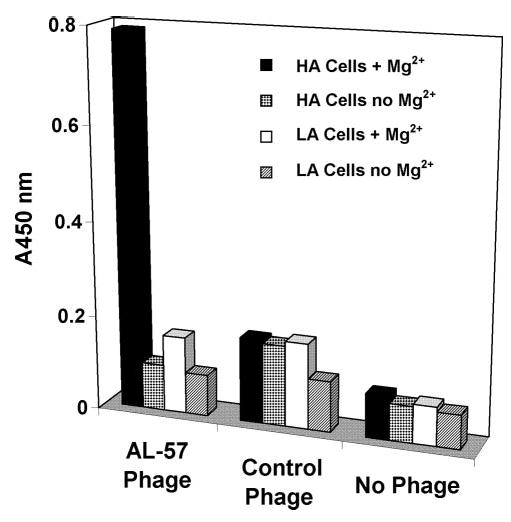
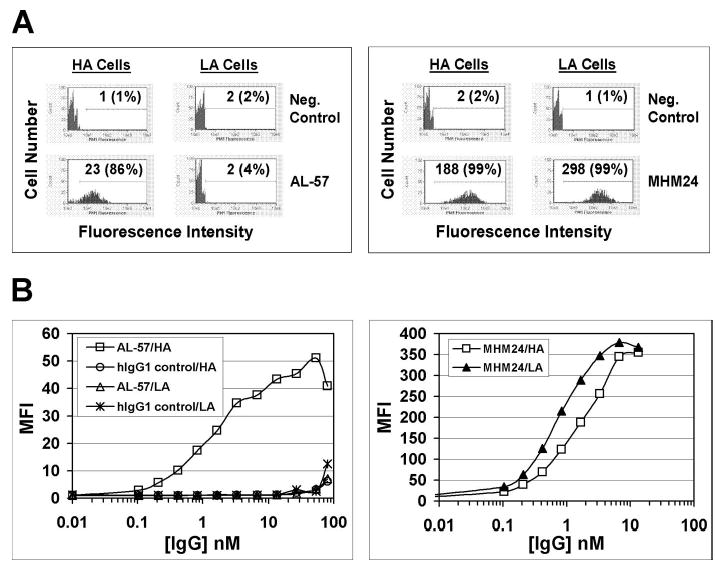
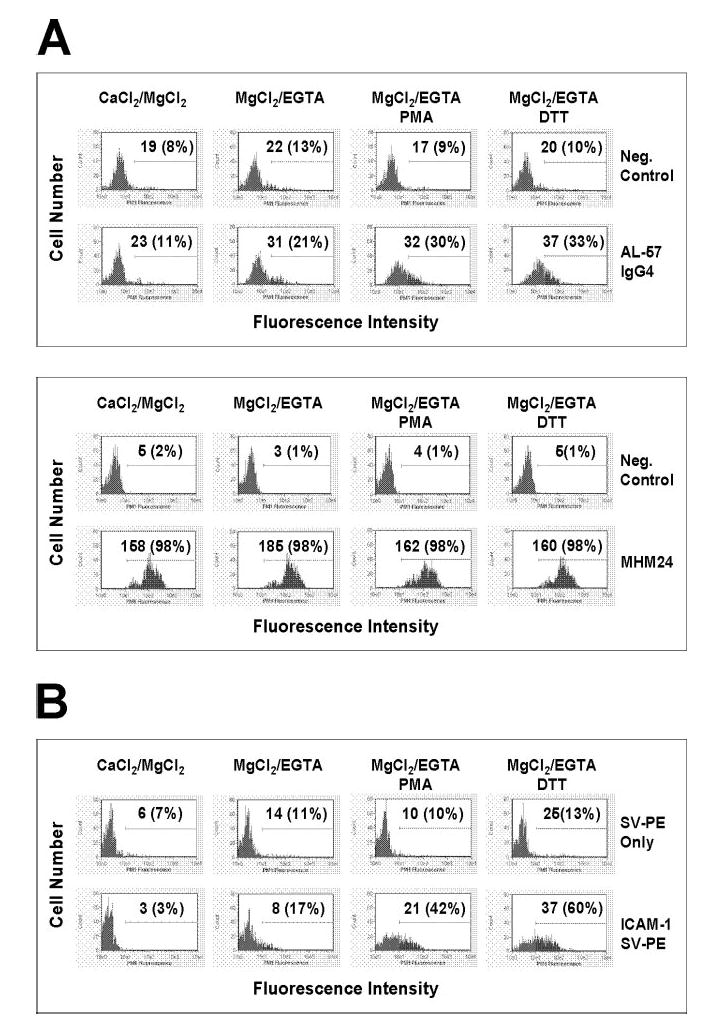
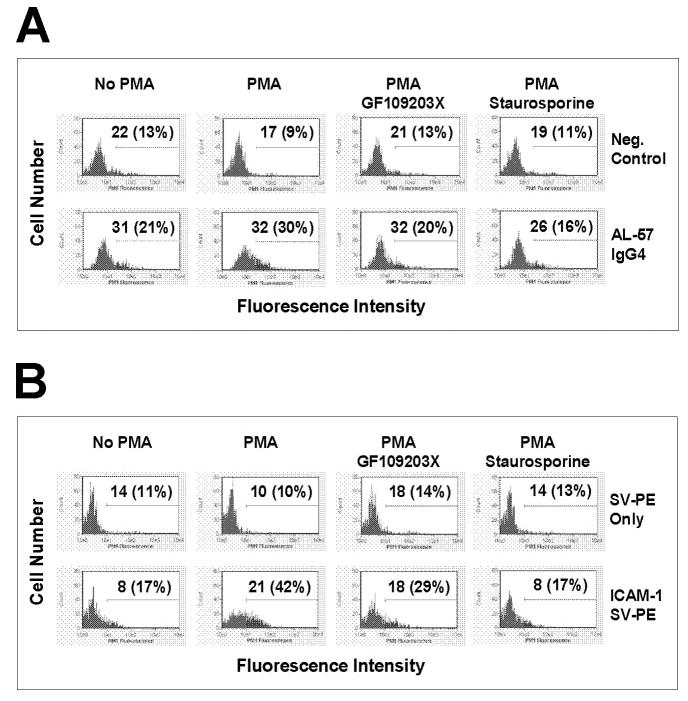
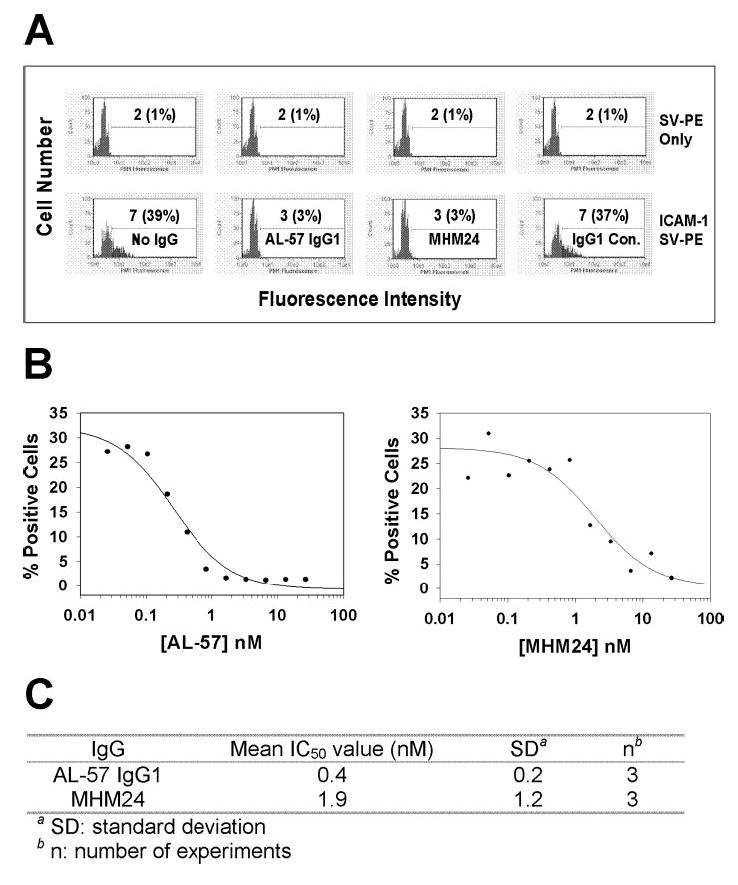
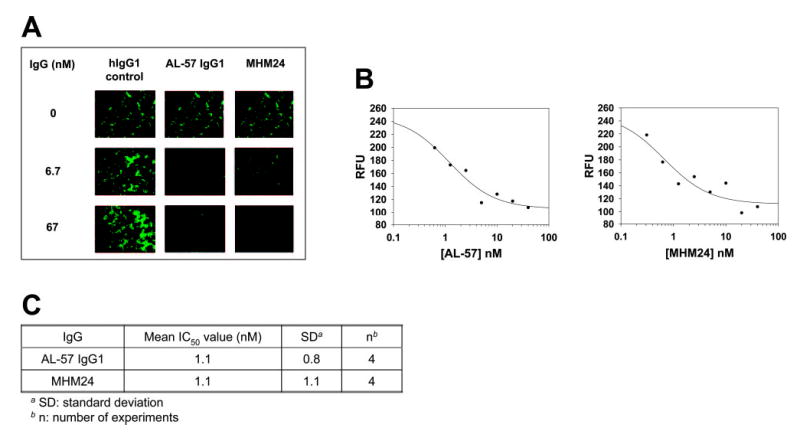
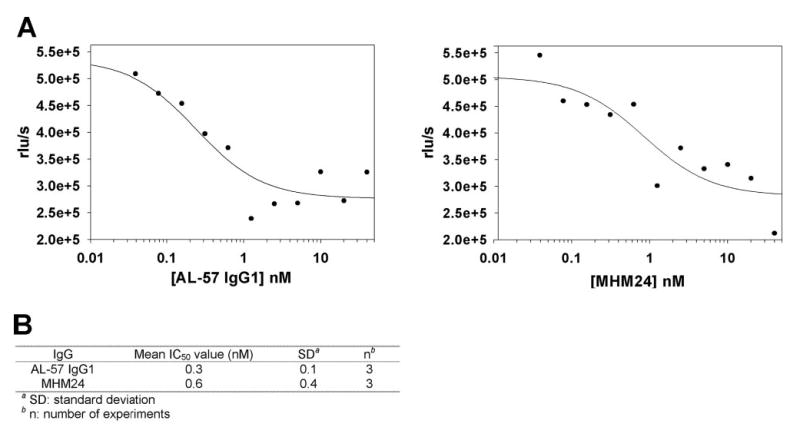
LFA-1 (alpha(L)beta(2)) mediates cell-cell and cell-extracellular matrix adhesions essential for immune and inflammatory responses. One critical mechanism regulating LFA-1 activity is the conformational change of the ligand-binding alpha(L) I domain from low-affinity (LA), closed form, to the high-affinity (HA), open form. Most known integrin antagonists bind both forms. Antagonists specific for the HA alpha(L) I domain have not been described. Here, we report the identification and characterization of a human antibody AL-57, which binds to the alpha(L) I domain in a HA but not LA conformation. AL-57 was discovered by selection from a human Fab-displaying library using a locked-open HA I domain as target. AL-57 Fab-phage bound HA I domain-expressing K562 cells (HA cells) in a Mg(2+)-dependent manner. AL-57 IgG also bound HA cells and PBMCs, activated by Mg(2+)/EGTA, PMA, or DTT. The binding profile of AL-57 IgG on PBMCs was the same as that of ICAM-1, the main ligand of LFA-1. In contrast, an anti-alpha(L) murine mAb MHM24 did not distinguish between the HA and LA forms. Moreover, AL-57 IgG blocked ICAM-1 binding to HA cells with a potency greater than MHM24. It also inhibited ICAM-1 binding to PBMCs, blocked adhesion of HA cells to keratinocytes, and inhibited PHA-induced lymphocyte proliferation with potencies comparable with MHM24. These results indicate that specifically targeting the HA I domain is sufficient to inhibit LFA-1-mediated, adhesive functions. AL-57 represents a therapeutic candidate for treatment of inflammatory and autoimmune diseases.


Figures

Fig. 1
Fig. 1
AL-57 Fab-phage specifically binds to HA cells in a Mg2+-dependent manner. Whole cell ELISAs were carried out with unfixed HA and LA cells in the presence or absence of Mg2+. ELISA signals of AL-57 phage, a negative control phage, and no phage control are shown. Absorbance at 450 nm (A450 nm) of each sample condition is plotted in the histogram.
Fig. 2
Fig. 2
AL-57 IgG1 specifically binds to HA cells but not LA cells. Binding of AL-57 IgG1 and MHM24 to HA and LA cells was determined by flow cytometric analysis. (A) Representative histograms of samples in the absence or presence of AL-57 IgG1 or MHM24 at 1.7 nM. The x-axis depicts the relative fluorescence intensity of individual cells, and the y-axis represents the cell number. Neg. Control indicates negative control with just the secondary PE-labeled antibody used for staining. The numbers shown are relative values of mean fluorescence intensity (MFI) with relative percentages of positive cells in parenthesis. (B) Concentration-dependent binding of AL-57 IgG1, hIgG1 control, and MHM24 to HA and LA cells. Cells were incubated with serially diluted AL-57 IgG1, hIgG1 control, or MHM24, followed by staining with secondary anti-hIgG- or anti-mouse IgG-PE. Plotted in each diagram is MFI as a function of the IgG concentration.
Fig. 3
Fig. 3
AL-57 IgG4 and ICAM-1 bind to the activated HA form of LFA-1 on PBMCs. Binding of AL-57 IgG4 (A) and ICAM-1 (B) to PBMCs with inactivating buffer (CaCl2/MgCl2) or with activating buffer (MgCl2/EGTA) in the presence or absence of PMA (10 ng/ml) or DTT (500 μM) was determined by flow cytometric analysis as described in Materials and Methods. The concentration of each IgG or ICAM-1 used was 10 μg/ml. For AL-57 staining, Neg. Control indicates negative control with just the secondary PE-labeled antibody used for staining; MHM24 was used as a control that did not distinguish between the HA and LA forms of LFA-1. For ICAM-1 staining, a multimeric complex [ICAM-1/streptavidin (SV)-PE] of biotinylated human ICAM-1-Fc and PE-labeled streptavidin was used; SV-PE only indicates negative control with just the PE-labeled streptavidin used for staining. Shown here are representative histograms of samples under indicated conditions. The x-axis depicts the fluorescence intensity of individual cells, and the y-axis represents the cell number. The numbers shown are relative values of MFI with relative percentages of positive cells in parenthesis.
Fig. 4
Fig. 4
PMA-induced enhancement in AL-57 and ICAM-1 binding to PBMCs is blocked by PKC inhibitors. Binding of AL-57 IgG4 (A) and ICAM-1 (B) to PBMCs with activating buffer (MgCl2/EGTA) in the presence or absence of PMA (10 ng/ml) and PKC inhibitor GF109203X (10 μM) or staurosporine (1 μM) was determined by flow cytometric analysis. The concentration of AL-57 IgG4 or ICAM-1 used was 10 μg/ml. For AL-57 IgG4 staining, Neg. Control indicates negative control with just the secondary PE-labeled antibody used for staining; MHM24, a nonselective binder, was also used as a control. For ICAM-1 staining, a multimeric complex (ICAM-1/SV-PE) was used; SV-PE only indicates negative control with just the PE-labeled streptavidin used for staining. Shown here are representative histograms of samples under indicated conditions. The x-axis depicts the fluorescence intensity of individual cells, and the y-axis represents the cell number. The numbers shown are relative values of MFI with relative percentages of positive cells in parenthesis.
Fig. 5
Fig. 5
AL-57 IgG1 inhibits ICAM-1 binding to HA cells. ICAM-1 binding in the presence or absence of each IgG was measured by staining HA cells with a soluble, multimeric ICAM-1 complex with ICAM-1-Fc concentration at 2 μg/ml and flow cytometric analysis. (A) Representative histograms of samples in the absence or presence of AL-57 IgG1, MHM24, or hIgG1 control at 4 μg/ml (26.8 nM). The x-axis depicts the fluorescence intensity of individual cells, and the y-axis represents the cell number. SV-PE only indicates negative control with PE-labeled streptavidin alone for staining. The numbers shown are relative values of MFI with relative percentages of positive cells in parenthesis. (B) IC50 determination of AL-57 IgG1 and MHM24. The percentage of positive cells from each sample was plotted as a function of the IgG concentration. From the representative plots shown here, IC50 values were calculated to be 0.3 nM for AL-57 IgG1 and 2 nM for MHM24 using SigmaPlot 8.0 software. (C) Summary of IC50 values from three independent experiments.
Fig. 6
Fig. 6
AL-57 IgG1 inhibits HA cell adhesion to keratinocytes. HA cells were labeled with calcein AM, preincubated with AL-57 IgG1, MHM24, or hIgG1 control, and added to a keratinocyte monolayer. After washing to remove unattached cells, remaining cells were photographed using fluorescence microscopy, and total fluorescence was measured using a fluorescence plate reader. (A) Representative pictures from samples treated without or with AL-57 IgG1, MHM24, or hIgG1 control at concentrations of 6.7 or 67 nM. (B) IC50 determination of AL-57 IgG1 and MHM24. Relative fluorescence units (RFU) from each sample were plotted as a function of the IgG concentration. From the representative plots shown here, IC50 values were calculated to be 1.2 nM for AL-57 IgG1 and 0.7 nM for MHM24 using SigmaPlot 8.0 software. (C) Summary of IC50 values from four independent experiments.
Fig. 7
Fig. 7
AL-57 IgG1 inhibits PHA-induced cell proliferation. PBMCs were treated with PHA at 1 μg/ml in the presence of Mg2+, serially diluted IgG for 3 days, and then analyzed for proliferation using a BrdU chemiluminescence assay. (A) IC50 determination of AL-57 IgG1 and MHM24. Relative luminescence units per second (rlu/s) from each sample were plotted as a function of the IgG concentration. From the representative plots shown here, IC50 values were calculated to be 0.2 nM for AL-57 IgG1 and 0.8 nM for MHM24, using SigmaPlot 8.0 software. (B) Summary of IC50 values from three independent experiments.

Similar articles

Cited by

References

    1. Shimaoka M, Takagi J, Springer TA. Conformational regulation of integrin structure and function. Annu Rev Biophys Biomol Struct. 2002;31:485–516. - PubMed
    1. Springer TA. Adhesion receptors of the immune system. Nature. 1990;346:425–434. - PubMed
    1. de Fougerolles AR, Springer TA. Intercellular adhesion molecule 3, a third adhesion counter-receptor for lymphocyte function-associated molecule 1 on resting lymphocytes. J Exp Med. 1992;175:185–190. - PMC - PubMed
    1. Carman CV, Jun C, Salas A, Springer TA. Endothelial cells proactively form microvilli-like membrane projections upon intercellular adhesion molecule 1 engagement of leukocyte LFA-1. J Immunol. 2003;171:6135–6144. - PubMed
    1. Larson RS, Springer TA. Structure and function of leukocyte integrins. Immunol Rev. 1990;114:181–217. - PubMed

Publication types

MeSH terms

Substances

Associated data