. 2006 Oct;174(2):1063-8.
doi: 10.1534/genetics.106.059469. Epub 2006 Aug 3.

Assessing the significance of quantitative trait loci in replicable mapping populations

Affiliations

Assessing the significance of quantitative trait loci in replicable mapping populations

Fei Zou et al. Genetics. 2006 Oct.

Abstract

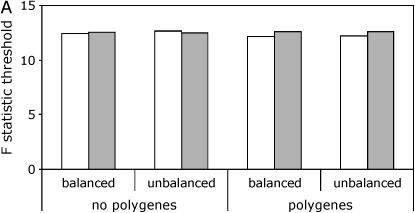
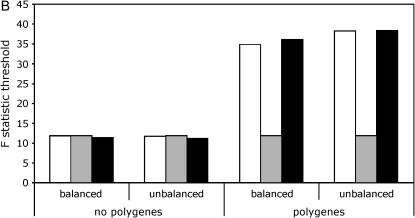
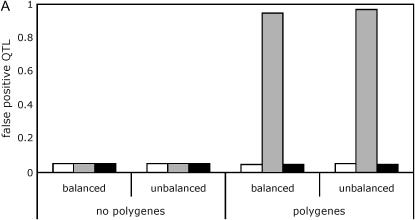
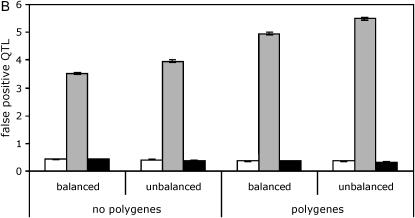
Replicable populations, such as panels of recombinant inbred or doubled haploid lines, are convenient resources for the mapping of QTL. To increase mapping power, replications are often collected within each RI line and a common way to analyze such data is to include in the QTL model only a single measurement from each line that represents the average among the replicates (a line means model). An obvious, but seldom explored, alternative, is to include every replicate in the model (a full data model). Here, we use simulations to compare these two approaches. Further, we propose an extension of the standard permutation procedure that is required to correctly control the type I error in mapping populations with nested structure.


Figures

F<sc>igure</sc> 1.—
Figure 1.—
Critical thresholds for QTL detection with different models and permutation procedures. Thresholds derived by simulation are labeled as “true.” Results are shown for a panel size of 100 lines and a marker spacing of 10 cM. (A) Line means model. True, open bars; standard, shaded bars. (B) Full data model. True, open bars; standard, shaded bars; nested, solid bars.
F<sc>igure</sc> 2.—
Figure 2.—
Effect of polygenic background variation and balance of design on QTL mapping. Results are shown for a panel size of 100 lines and a marker spacing of 10 cM. Line means, open bars; standard, shaded bars; nested, solid bars. (A) False positives. No QTL is present. (B) False positives. Five QTL are present. (C) True positives. Five QTL are present.
F<sc>igure</sc> 3.—
Figure 3.—
Effect of line number and marker spacing on QTL mapping. Results are shown for simulations with five QTL in an unbalanced design. Line means, open bars; standard, shaded bars; nested, solid bars. (A) False positives. (B) True positives.
F<sc>igure</sc> 3.—
Figure 3.—
Effect of line number and marker spacing on QTL mapping. Results are shown for simulations with five QTL in an unbalanced design. Line means, open bars; standard, shaded bars; nested, solid bars. (A) False positives. (B) True positives.

References

    1. Alonso-Blanco, C., S. E. El-Assal, G. Coupland and M. Koornneef, 1998. Analysis of natural allelic variation at flowering time loci in the Landsberg erecta and Cape Verde Islands ecotypes of Arabidopsis thaliana. Genetics 149: 749–764. - PMC - PubMed
    1. Bailey, D. W., 1971. Recombinant-inbred strains. An aid to finding identity, linkage, and function of histocompatibility and other genes. Transplantation 11: 325–327. - PubMed
    1. Burr, B., F. A. Burr, K. H. Thompson, M. C. Albertson and C. W. Stuber, 1988. Gene mapping with recombinant inbreds in maize. Genetics 118: 519–526. - PMC - PubMed
    1. Churchill, G. A., and R. W. Doerge, 1994. Empirical threshold values for quantitative trait mapping. Genetics 138: 963–971. - PMC - PubMed
    1. Fry, J. D., S. V. Nuzhdin, E. G. Pasyukova and T. F. Mackay, 1998. QTL mapping of genotype-environment interaction for fitness in Drosophila melanogaster. Genet. Res. 71: 133–141. - PubMed

Publication types