

doi: 10.1385/1-59745-097-9:175.
Mining microarray data at NCBI's Gene Expression Omnibus (GEO)*
Affiliations
- PMID: 16888359
- PMCID: PMC1619899
- DOI: 10.1385/1-59745-097-9:175
Item in Clipboard
Mining microarray data at NCBI's Gene Expression Omnibus (GEO)*
Methods Mol Biol.
2006.
Abstract
The Gene Expression Omnibus (GEO) at the National Center for Biotechnology Information (NCBI) has emerged as the leading fully public repository for gene expression data. This chapter describes how to use Web-based interfaces, applications, and graphics to effectively explore, visualize, and interpret the hundreds of microarray studies and millions of gene expression patterns stored in GEO. Data can be examined from both experiment-centric and gene-centric perspectives using user-friendly tools that do not require specialized expertise in microarray analysis or time-consuming download of massive data sets. The GEO database is publicly accessible through the World Wide Web at http://www.ncbi.nlm.nih.gov/geo.
Figures
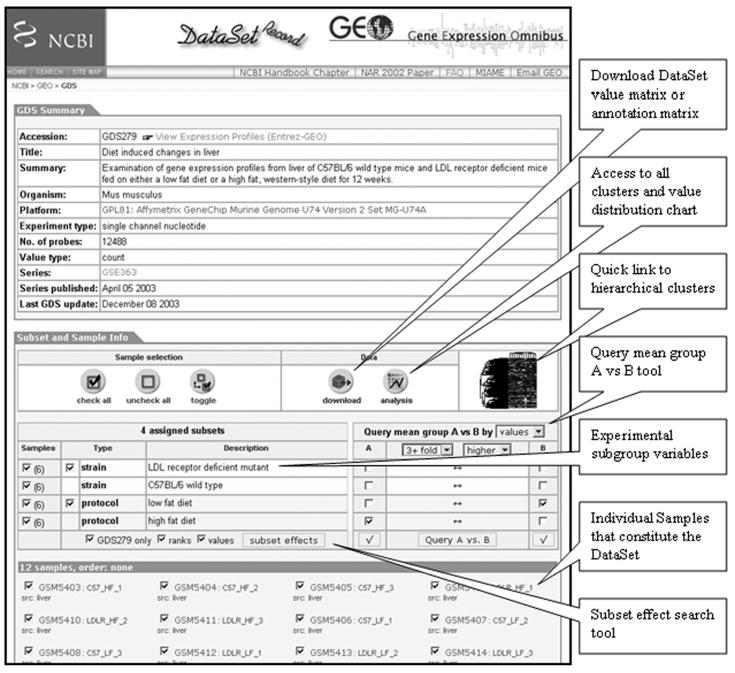
GEO DataSet record. A screen shot of a typical DataSet record, GDS279, which investigates the effect of a high-fat diet on liver tissue in wild-type and LDL receptor-deficient mice (6). The locations of the main DataSet features and tools are indicated.
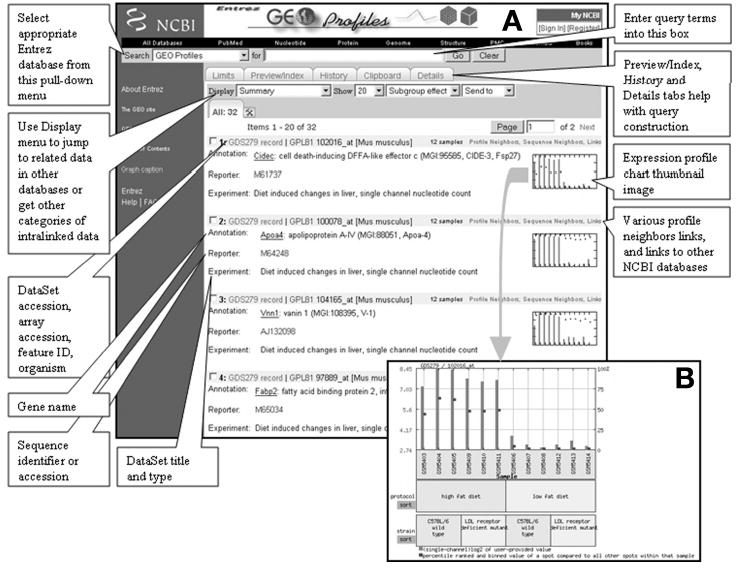
Screenshot of GEO Profiles retrievals and expanded profile chart. (A) Screen shot of GEO Profiles retrievals for GDS279, a DataSet that investigates the effect of a high-fat diet on liver tissue in wild-type and LDL receptor-deficient mice (6). Each retrieval represents an individual gene on the array. The locations of various features are indicated. (B) Expanded chart for the Cidec gene. The chart bars represent relative gene expression levels in each Sample across the DataSet (see Note 4). The squares represent rank information; ranks are calculated by rank-ordering expression values for all the genes that are present on the array for each Sample and then placing them into percentile bins. Thus, ranks give an indication of the level of expression of that gene compared with all other genes on the array (or they can be an indication of when data are not properly normalized; see Notes 5 and 6). The bars at the foot of the chart reflect experimental design (see Note 7). From the chart, it is clear that expression of Cidec is upregulated in both strains of mice fed a high-fat diet.
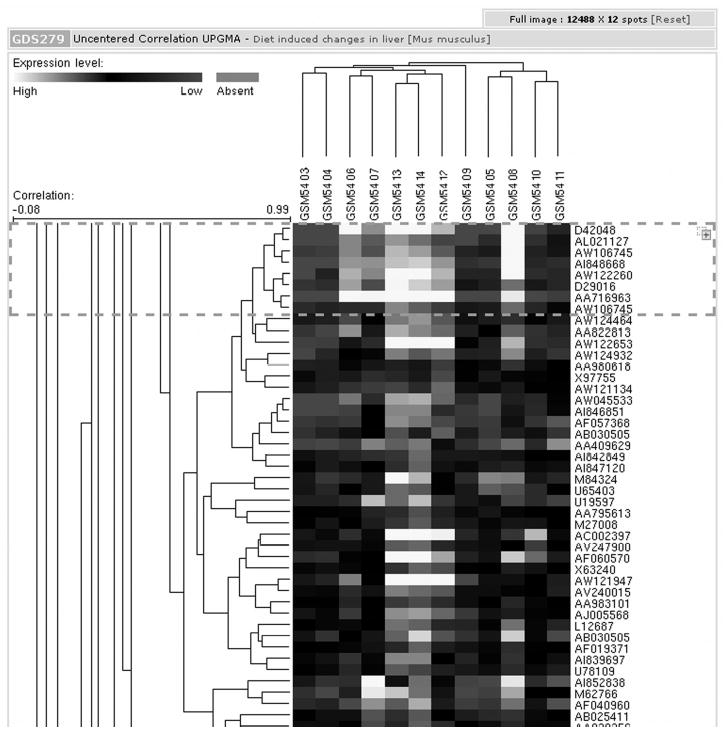
DataSet cluster analysis. Section of DataSet GDS279 uncentered correlation UPGMA hierarchical cluster analysis. Each column represents an individual Sample, or hybridization; each row represents a gene, identified by a GenBank accession number. The light color indicates high expression and the darker color low expression. The dashed box can be moved and resized to select regions of interest, the data for which may be downloaded, or exported to Entrez GEO Profiles.
References
MeSH terms
LinkOut - more resources
Full Text Sources
Molecular Biology Databases
