. 2006:338:245-60.
doi: 10.1385/1-59745-097-9:245.

Protein binding microarrays (PBMs) for rapid, high-throughput characterization of the sequence specificities of DNA binding proteins

Affiliations

Protein binding microarrays (PBMs) for rapid, high-throughput characterization of the sequence specificities of DNA binding proteins

Michael F Berger et al. Methods Mol Biol. 2006.

Abstract

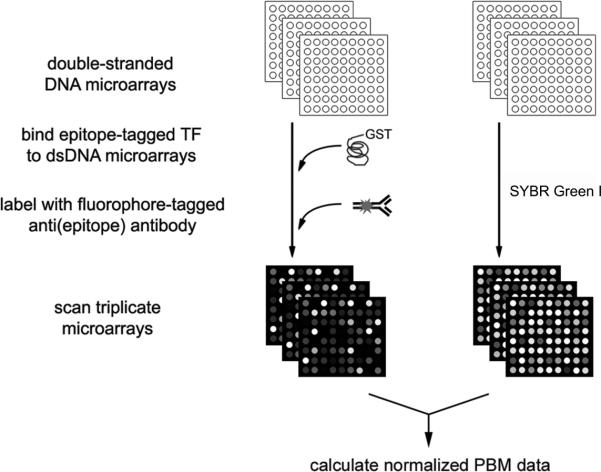
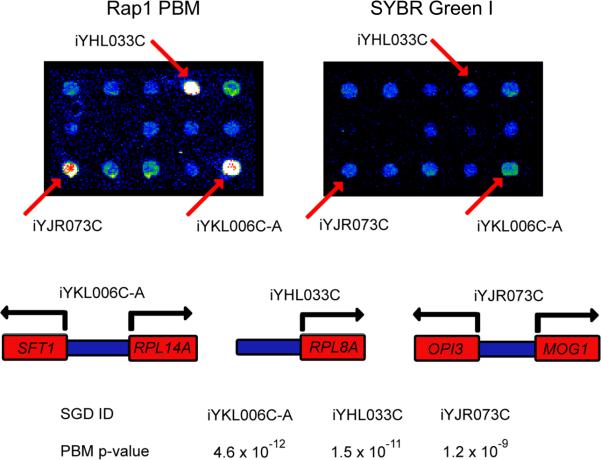
DNA binding proteins play a number of key roles in cells, in processes including transcriptional regulation, recombination, genome rearrangements, and DNA replication, repair, and modification. Of particular interest are the interactions between transcription factors and their DNA binding sites, as they are an integral part of the transcriptional regulatory networks that control gene expression. Despite their importance, the DNA binding specificities of most DNA binding proteins remain unknown, as earlier technologies aimed at characterizing DNA-protein interactions have been time consuming and not highly scalable. We have developed a new DNA microarray-based technology, termed protein binding microarrays (PBMs), that allows rapid, high-throughput characterization of the in vitro DNA binding site sequence specificities of transcription factors in a single day. The resulting DNA binding site data can be used in a number of ways, including for the prediction of the genes regulated by a given transcription factor, annotation of transcription factor function, and functional annotation of the predicted target genes.


Figures

Figure 1
Figure 1
Schema of protein binding microarray experiments. (Reproduced from ref. 2 with permission from Nature Publishing Group.)
Figure 2
Figure 2
Magnification of identical portions of a yeast intergenic microarrays used in a PBM experiment (left panel) or stained with SYBR Green I (right panel). Fluorescence intensities are shown in false color, with white indicating saturated signal intensity, red indicating high signal intensity, yellow and green indicating moderate signal intensity, and blue indicating low signal intensity. The three labeled spots correspond to the intergenic regions depicted below, along with the P-values derived from triplicate PBM and SYBR Green I microarray data. (Reproduced from ref. 2 with permission from Nature Publishing Group.)
Figure 3
Figure 3
Identification of the DNA binding site motif from the significantly bound spots. (a) Distribution of ratios of PBM data, normalized by SYBR Green I data, for the yeast transcription factor Rap1 bound to yeast intergenic microarrays. The arrow indicates those spots passing a P-value cutoff of 0.001 after correction for multiple hypothesis testing. Indicated in dark gray are spots with an exact match to a sequence belonging to the PBM-derived binding site motif. (b) Sequence logo (15) of the PBM-derived motif for the yeast transcription factor Rap1. (Reproduced from ref. 2 with permission from Nature Publishing Group.)
Figure 3
Figure 3
Identification of the DNA binding site motif from the significantly bound spots. (a) Distribution of ratios of PBM data, normalized by SYBR Green I data, for the yeast transcription factor Rap1 bound to yeast intergenic microarrays. The arrow indicates those spots passing a P-value cutoff of 0.001 after correction for multiple hypothesis testing. Indicated in dark gray are spots with an exact match to a sequence belonging to the PBM-derived binding site motif. (b) Sequence logo (15) of the PBM-derived motif for the yeast transcription factor Rap1. (Reproduced from ref. 2 with permission from Nature Publishing Group.)
Figure 4
Figure 4
Examples of DNA microarray spot quality. Identical portions of yeast intergenic microarrays printed onto Corning® GAPS II slides, processed in different ways (see below) before UV crosslinking, and then stained with SYBR Green I. Images have been false-colored as in Figure 2. Examples of microarrays with poor spot quality are shown in (a) and (b). In both of these cases, the DNA is distributed non-uniformly, with either (a) high concentrations near the centers of spots, or (b) high concentrations along spot perimeters. Both of these microarrays resulted from two separate print runs, from which microarrays were UV crosslinked without first rehydrating and baking. An example of a good quality microarray is shown in (c). This microarray was rehydrated and then baked before being UV crosslinked.

References

    1. Bulyk M. Computational prediction of transcription-factor binding site locations. Genome Biol. 2003;5:201. - PMC - PubMed
    1. Mukherjee S, Berger MF, Jona G, Wang XS, Muzzey D, Snyder M, Young RA, Bulyk ML. Rapid analysis of the DNA-binding specificities of transcription factors with DNA microarrays. Nat. Genet. 2004;36:1331–1339. - PMC - PubMed
    1. Sambrook J, Fritsch E, Maniatis T. Molecular Cloning: A Laboratory Manual. 2nd Ed. 3 vols. Cold Spring Harbor Laboratory Press; Cold Spring Harbor, NY: 1989.
    1. Liu X, Brutlag D, Liu J. BioProspector: discovering conserved DNA motifs in upstream regulatory regions of co-expressed genes. Pac. Symp. Biocomput. 2001:127–138. - PubMed
    1. Hughes JD, Estep PW, Tavazoie S, Church GM. Computational identification of cis-regulatory elements associated with groups of functionally related genes in Saccharomyces cerevisiae. J. Mol. Biol. 2000;296:1205–1214. - PubMed

Publication types

MeSH terms

LinkOut - more resources