. 2006 Aug 4:6:203.
doi: 10.1186/1471-2458-6-203.

Similar support for three different life course socioeconomic models on predicting premature cardiovascular mortality and all-cause mortality

Affiliations

Similar support for three different life course socioeconomic models on predicting premature cardiovascular mortality and all-cause mortality

Maria Rosvall et al. BMC Public Health. .

Abstract

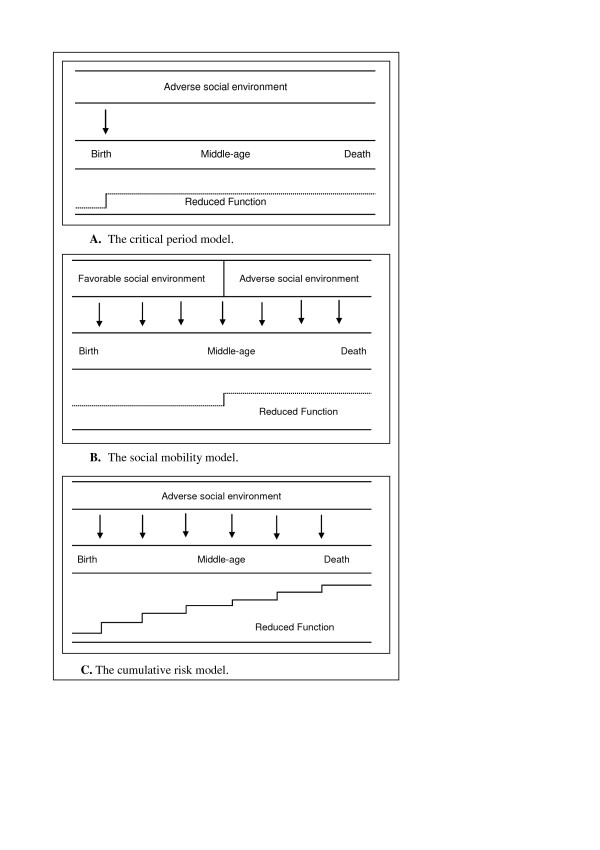
Background: There are at least three broad conceptual models for the impact of the social environment on adult disease: the critical period, social mobility, and cumulative life course models. Several studies have shown an association between each of these models and mortality. However, few studies have investigated the importance of the different models within the same setting and none has been performed in samples of the whole population. The purpose of the present study was to study the relation between socioeconomic position (SEP) and mortality using different conceptual models in the whole population of Scania.

Methods: In the present investigation we use socioeconomic information on all men (N = 48,909) and women (N = 47,688) born between 1945 and 1950, alive on January, 1st,1990, and living in the Region of Scania, in Sweden. Focusing on three specific life periods (i.e., ages 10-15, 30-35 and 40-45), we examined the association between SEP and the 12-year risk of premature cardiovascular mortality and all-cause mortality.

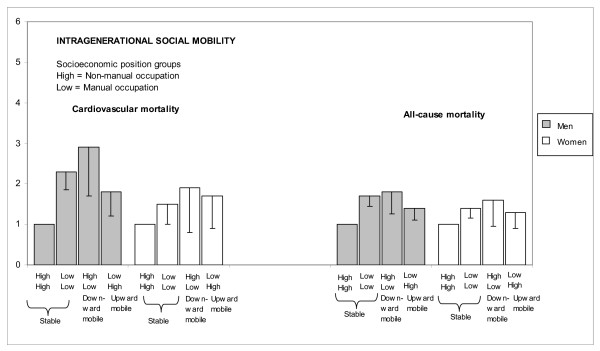
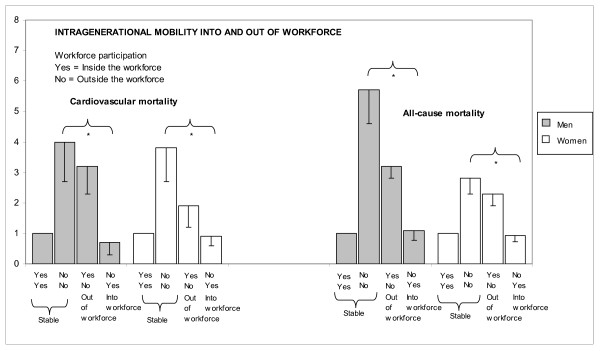
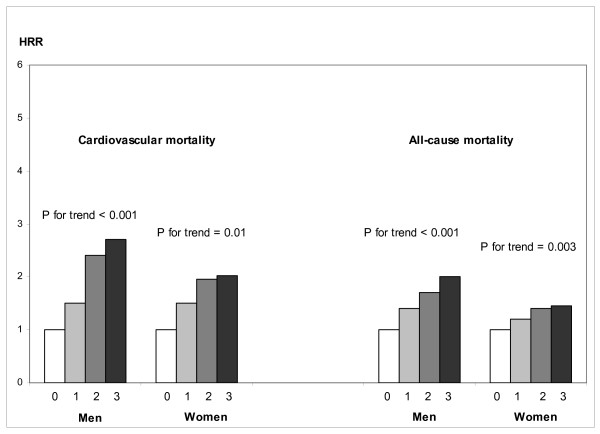
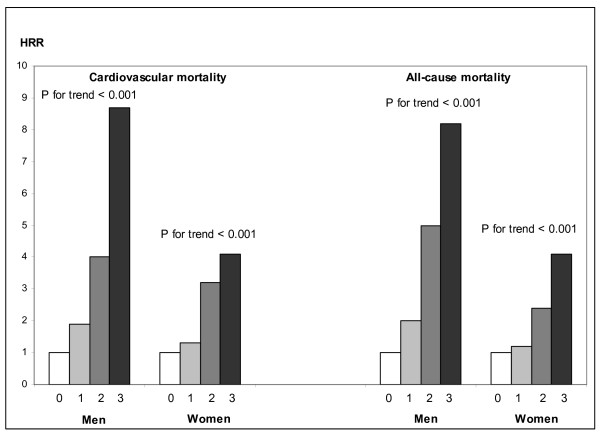
Results: There was a strong relation between SEP and mortality among those inside the workforce, irrespective of the conceptual model used. There was a clear upward trend in the mortality hazard rate ratios (HRR) with accumulated exposure to manual SEP in both men (p for trend < 0.001 for both cardiovascular and all-cause mortality) and women (p for trend = 0.01 for cardiovascular mortality) and (p for trend = 0.003 for all-cause mortality). Inter- and intragenerational downward social mobility was associated with an increased mortality risk. When applying similar conceptual models based on workforce participation, it was shown that mortality was affected by the accumulated exposure to being outside the workforce.

Conclusion: There was a strong relation between SEP and cardiovascular and all-cause mortality, irrespective of the conceptual model used. The critical period, social mobility, and cumulative life course models, showed the same fit to the data. That is, one model could not be pointed out as "the best" model and even in this large unselected sample it was not possible to adjudicate which theories best describe the links between life course SEP and mortality risk.


Figures

Figure 1
Figure 1
Crude schematic illustration of three life course socioeconomic models. A. Critical period model: focuses on the importance of an independent effect of social exposure during a specific sensitive period in life having lasting effects on adult health; B. Social mobility model: focuses on the importance of change in social position to adult health. C. Cumulative model: focuses on the importance of accumulation of risk during the life course to adult health.
Figure 2
Figure 2
Age-adjusted HRRs for cardiovascular and all-cause mortality, by intragenerational socioeconomic mobility in Swedish men and women. Only subjects having either a manual or non-manual SEP at the three stages in life were included in the analyses. The different categories at each bar denotes socioeconomic position (SEP) at different periods in life – age 30–35 and age 40–45. Those stable non-manual at age 30–35 and at age 40–45 were used as the reference. The lower border of the 95 % confidence interval (CI) is marked.
Figure 3
Figure 3
Age-adjusted HRRs for cardiovascular and all-cause mortality, by intragenerational mobility into and out of the workforce in Swedish men and women. The different categories at each bar denotes workforce participation at different periods in life – age 30–35 and at age 40–45. Those stable inside the workforce at age 30–35 and at age 40–45 were used as the reference. The lower border of the 95% confidence interval (CI) is marked.
Figure 4
Figure 4
Bar graph showing age-adjusted HRRs of cardiovascular and all-cause mortality by a life course socioeconomic position (LCSEP) score ranging from 0 to 3 (combining childhood socioeconomic position, i.e., the SEP of the head of the household at ages 10–15, with the subject's own SEP at age 30–35 and at age 40–45: non-manual employees were given 0 points and manual workers were given 1 point). Only subjects having either a manual or non-manual SEP at the three stages in life were included in the analyses. P-values show p for trend in HRRs for cardiovascular and all-cause mortality. Subjects whose childhood SEP was categorized as non-manual and who had a non-manual occupation at age 30–35 and at age 40–45 were used as the reference group.
Figure 5
Figure 5
Bar graph showing age-adjusted HRRs for cardiovascular and all-cause mortality by the life course workforce participation (LCWFP) score ranging from 0 to 3, combining workforce participation of the head of the household during childhood at age 10–15 with the subject's own workforce participation at age 30–35 and at age 40–45. Subjects who were categorized as being inside the workforce were given 0 points, while subjects categorized as being outside the workforce were given 1 point. P-values show p for trend in HRRs for cardiovascular and all-cause mortality. Subjects whose head of the household during childhood was categorized as being inside the workforce and who themselves were inside the workforce at age 30–35 and at age 40–45 were used as the reference group.

References

    1. Vågerö D, Leon D. Effect of social class in childhood and adulthood on adult mortality. Lancet. 1994;343:1224–5. doi: 10.1016/S0140-6736(94)92432-5. - DOI - PubMed
    1. Lynch JW, Kaplan GA, Cohen RD, Kauhanen J, Wilson TW, Smith NL, Salonen JT. Childhood and adult socioeconomic status as predictors of mortality in Finland. Lancet. 1994;343:524–7. doi: 10.1016/S0140-6736(94)91468-0. - DOI - PubMed
    1. Gliksman MD, Kawachi I, Hunter D, Colditz GA, Manson JE, Stampfer MJ, Speizer FE, Willett WC, Hennekens CH. Childhood socioeconomic status and risk of cardiovascular disease in middle-aged US women: a prospective study. J Epidemiol Community Health. 1995;49:10–15. - PMC - PubMed
    1. Davey Smith G, Hart C, Blane D, Gillis C, Hawthorne V. Lifetime socioeconomic position and mortality:prospective observational study. BMJ. 1997;314:547–52. - PMC - PubMed
    1. Hart CL, Davey Smith G, Blane D. Inequalities in mortality by social class measured at three stages of the lifecourse. Am J Public Health. 1998;88:471–4. - PMC - PubMed

Publication types

LinkOut - more resources