

Quantitative analysis of s-adenosylmethionine and s-adenosylhomocysteine in neurulation-stage mouse embryos by liquid chromatography tandem mass spectrometry
- PMID: 16890031
- PMCID: PMC7614419
- DOI: 10.1016/j.jchromb.2006.07.012
Quantitative analysis of s-adenosylmethionine and s-adenosylhomocysteine in neurulation-stage mouse embryos by liquid chromatography tandem mass spectrometry
Abstract
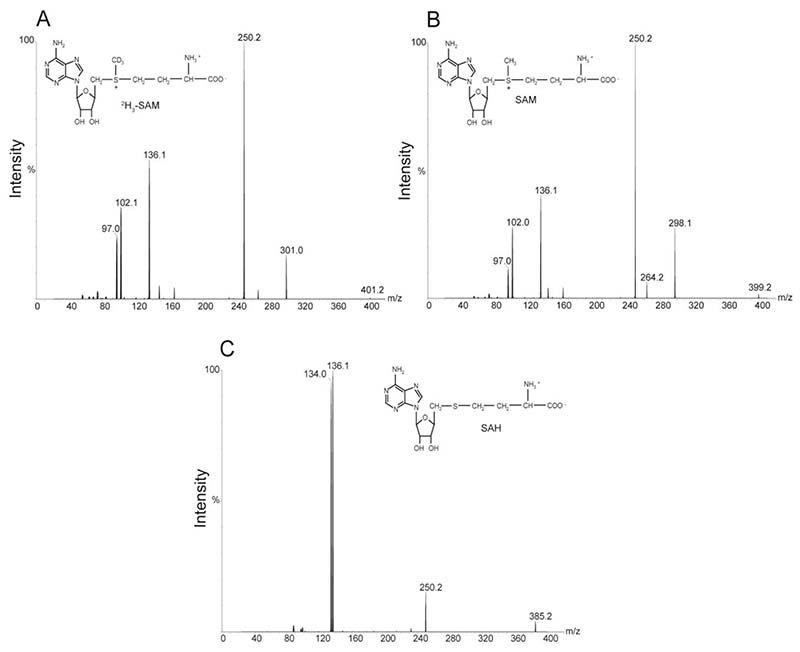
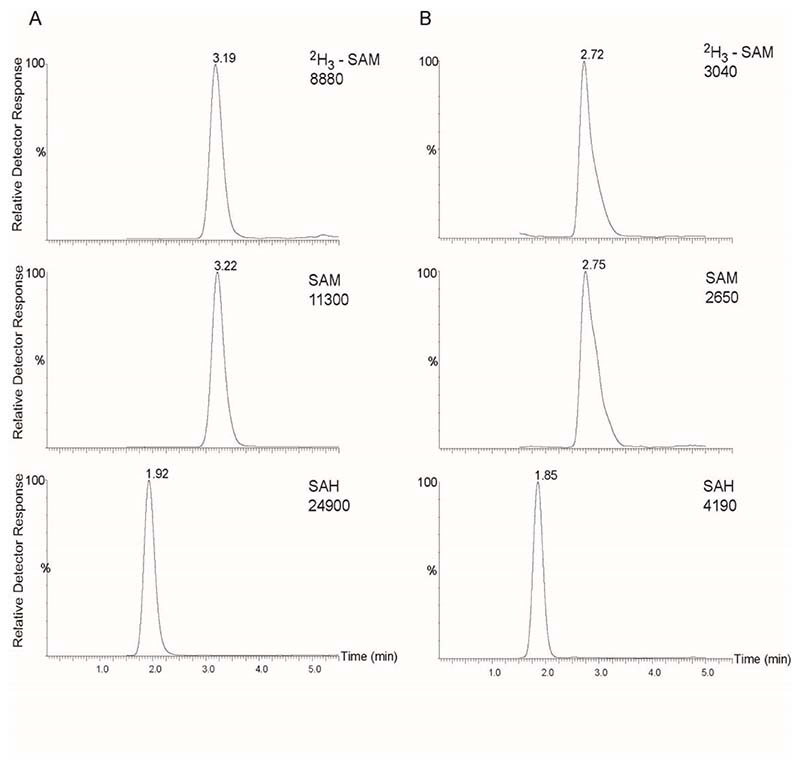
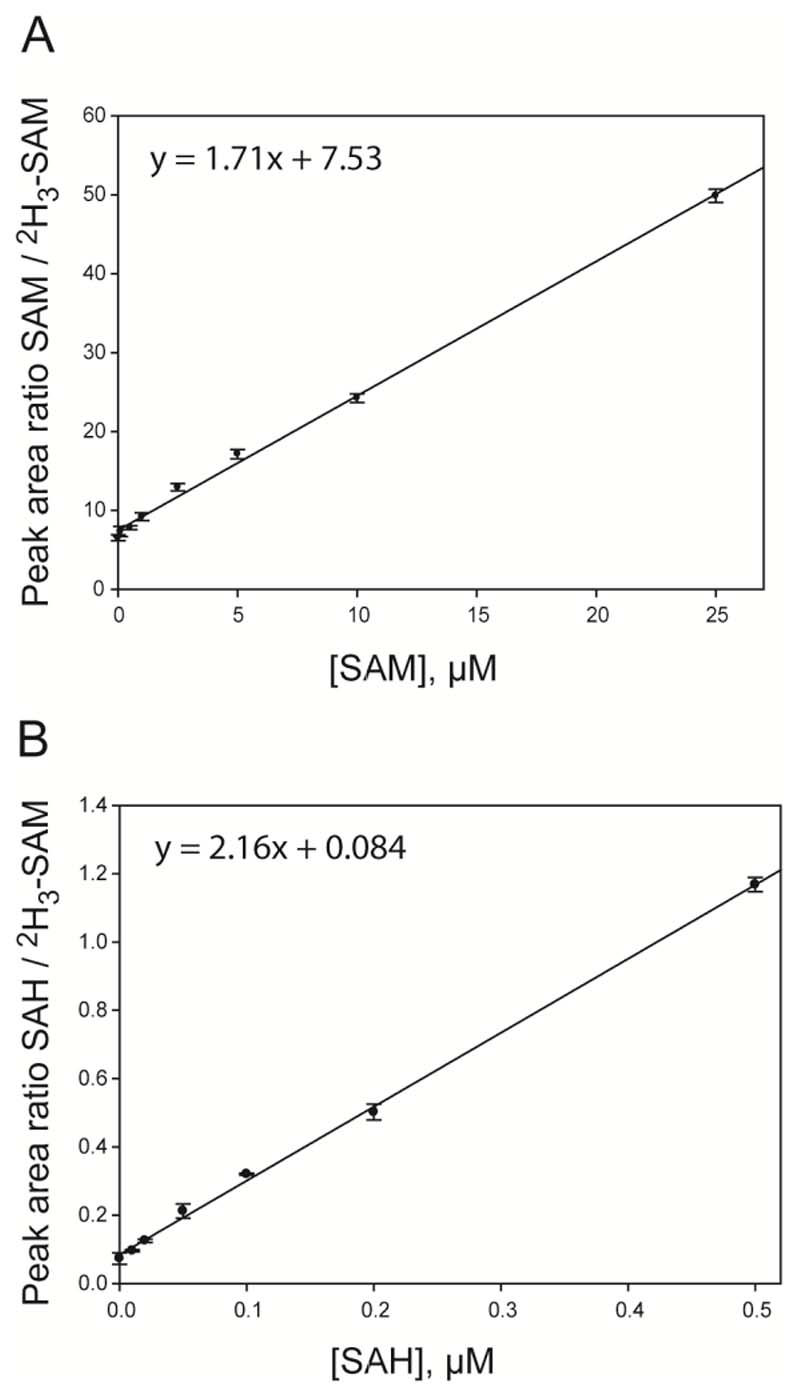
The potential importance of the methylation cycle during embryonic development necessitates the establishment of methodology to detect alterations in the relative abundance of s-adenosylmethionine (SAM) and s-adenosylhomocysteine (SAH) in an embryonic experimental system. We have developed a precise and sensitive method for measurement of SAM and SAH based on liquid chromatography coupled to tandem mass spectrometry (LC-MS/MS) in single neurulation-stage mouse embryos. Use of a penta-fluorinated high-performance liquid chromatography (HPLC) stationary phase gave enhanced sensitivity due to optimal ionisation in organic mobile phase and increased retention time compared to standard reversed-phase separation. Calibration curves suitable for the analysis of neurulation-stage mouse embryos (SAM 0.02-25.0microM, SAH 0.01-10.0microM) were linear (r(2)>0.997) with limits of detection for SAM and SAH of 10 and 2.5nmol/L, respectively.
Figures
References
-
- Friso S, Choi SW. J Nutr. 2002;132:2382S–2387S. - PubMed
-
- Vafai SB, Stock JB. Fed Eur Biochem Soc Lett. 2002;518:1–4. - PubMed
-
- Bergo MO, Leung GK, Ambroziak P, Otto JC, Casey PJ, Young SG. J Biol Chem. 2000;275:17605–17610. - PubMed
-
- De Cabo SF, Santos J, Fernandez-Piqueras J. Cytogenet. Cell Genet. 1995;71:187–192. - PubMed
-
- Finkelstein JD. EurJ Pediatr. 1998;157(Suppl 2):S40–S44. - PubMed
Publication types
MeSH terms
Substances
Grants and funding
LinkOut - more resources
Full Text Sources
