. 2006 Aug;195(2):373-88.
doi: 10.1016/j.ajog.2006.07.001.

Analysis of microarray experiments of gene expression profiling

Affiliations

Analysis of microarray experiments of gene expression profiling

Adi L Tarca et al. Am J Obstet Gynecol. 2006 Aug.

Abstract

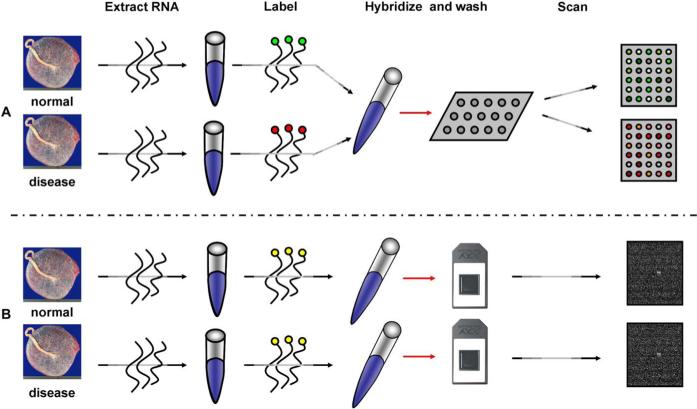
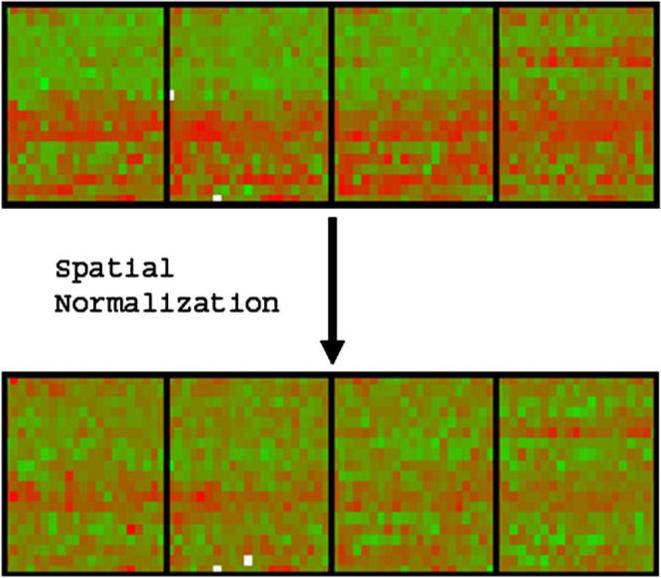
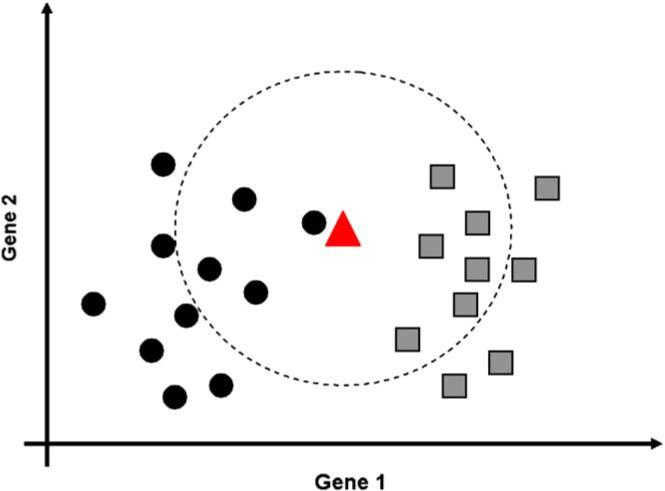
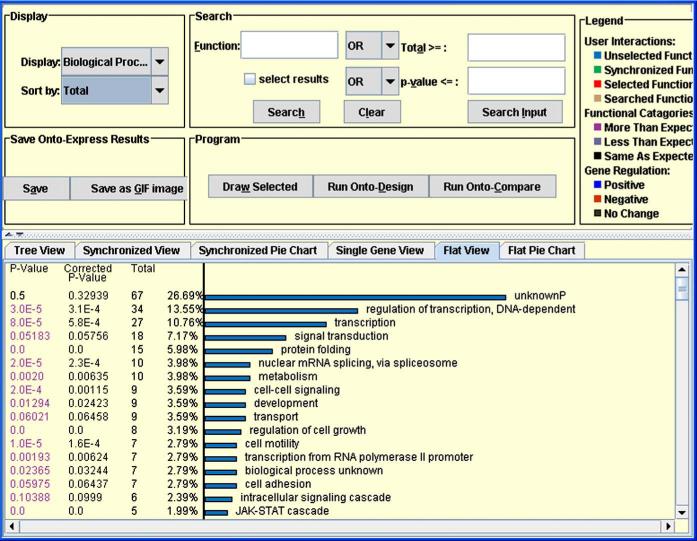
The study of gene expression profiling of cells and tissue has become a major tool for discovery in medicine. Microarray experiments allow description of genome-wide expression changes in health and disease. The results of such experiments are expected to change the methods employed in the diagnosis and prognosis of disease in obstetrics and gynecology. Moreover, an unbiased and systematic study of gene expression profiling should allow the establishment of a new taxonomy of disease for obstetric and gynecologic syndromes. Thus, a new era is emerging in which reproductive processes and disorders could be characterized using molecular tools and fingerprinting. The design, analysis, and interpretation of microarray experiments require specialized knowledge that is not part of the standard curriculum of our discipline. This article describes the types of studies that can be conducted with microarray experiments (class comparison, class prediction, class discovery). We discuss key issues pertaining to experimental design, data preprocessing, and gene selection methods. Common types of data representation are illustrated. Potential pitfalls in the interpretation of microarray experiments, as well as the strengths and limitations of this technology, are highlighted. This article is intended to assist clinicians in appraising the quality of the scientific evidence now reported in the obstetric and gynecologic literature.


Figures

Figure 1
Figure 1
Schematic representation of the steps involved in microarrays. A, The upper panel illustrates the two channel technology while the B, lower panel illustrates the single channel technology. The experiment is designed to compare the mRNA expression profile of placentas from women with normal pregnancy with that of placentas from patients with pre-eclampsia (disease). mRNA from the placenta is extracted. In panel A, the normal and disease mRNA are labeled with two different dyes, mixed and then hybridized on the same array. After washing, the array is scanned at two different wavelengths to yield two images: one for the placenta of a normal patient and one for the placenta of a patient with pre-eclampsia. In panel B (single channel), each sample is labeled with the same fluorescent dye, but independently hybridized on different arrays.
Figure 2
Figure 2
Examples of graphic display of expression profiling data obtained from one cDNA array (two channel technology). A shows a scatter plot of log-intensity values of the sample labeled with red dye (log(R)) versus the log-intensity values of the sample labeled with green dye (log[G]). The green channel may contain data derived from a normal placenta, while the data on the red channel may be derived from a patient with pre-eclampsia. Note that some genes are up-regulated in the red channel (pre-eclampsia). B is a different representation of the same data. The vertical axis is the log-ratio M = log(R/G) (log fold change), while the horizontal axis represents the average log-intensity A=logR+logG2. This representation is also known as a M vs. A plot. These two types of displays are frequently found in papers reporting microarray experiment results.
Figure 3
Figure 3
Two heat maps illustrating the spatial bias problem in 4 sub-arrays of a cDNA array. Each colored element corresponds to one gene. Positive log-ratios (log fold change) are shown in red, while negative log-ratios are shown in green. The top panel shows that most probes in the lower halves of the sub-arrays are positive (higher expression in the red channel). The bottom panel shows the same data after a spatial normalization algorithm has been applied to remove this bias (artifact).
Figure 4
Figure 4
A comparison of two gene selection methods illustrated in a, A, M vs. A plot and, B, in a volcano plot. Each circle corresponds to one gene. M represents the average log-ratio (log fold-change) in a two group comparison. The 2-fold change method selects as differentially expressed all genes above the line M = 1 and below the line M =−1 (red lines in both figures). In contrast, a moderated t-test will only select the genes represented by solid red circles. Note that not all genes with a fold change of two or more have significant P values (the P values are shown on the vertical axis of the volcano plot, in B). Conversely, not all the genes with significant P values have a fold change of two or more (note the solid dots between the two red lines).
Figure 5
Figure 5
k-Nearest Neighbor (k-NN) classification rule. This method is used in class prediction studies. The figure illustrates the 10-Nearest Neighbor (10-NN) rule in a two-class prediction problem using the expression levels of two genes (gene 1 on the horizontal axis, gene 2 on the vertical axis). The members of the two classes are designated by circles and squares, and their membership is known in advance. The triangle represents the expression values for these two genes for a new sample that needs to be classified. The large dotted circle contains the 10 nearest neighbors of the new sample. A neighbor corresponds to a sample that has similar expression values. Among the closest 10 neighbors of the red triangle, 6 are squares and 4 are circles. Therefore, the 10-NN rule predicts that the new sample belongs in the square class. Note that if we used only one neighbor (1-Nearest Neighbor rule), the same sample would be classified as belonging to the other class (circles), because the closest neighbor of the new sample (red triangle) is a circle and not a square.
Figure 6
Figure 6
Hierarchical clustering using one-channel microarrays data. This figure combines a “heat map,” which is the part of the figure containing colors (red, green, and black), with two dendrograms. Dendrograms are the tree-like structures displayed above and to the left of the heat map. The rows represent genes identified by the numbers on the right of the figure. The individual patient samples are shown as columns (1 column per sample). The color represents the expression level of the gene. Red represents high expression, while green represents low expression. The expression levels are continuously mapped on the color scale provided at the top of the figure. The dendrograms provide some qualitative means of assessing the similarity between genes and between patient samples. Note that the columns contain samples from two types of patients, A and B. Type A may represent samples from normal women and type B from women with pre-eclampsia. All women with the same diagnosis are grouped (clustered) together. This analysis was performed with the TM4 software suite (http://www.tm4.org).
Figure 7
Figure 7
An example of functional profiling. The figure shows the significant biological processes represented in a set of genes differentially expressed between two clinical groups. This type of analysis adds another dimension to the interpretation of microarrays data. The biological processes are represented as bars on the right side of the graph. The length of the bar represents the number of genes involved in that specific biological process. This analytical tool provides a raw and a corrected p-value for each biological process. Note that the biological process “protein folding” is represented by 15 genes, while “signal transduction” is represented by 18 genes (the number of genes is shown under the “Total” column). However, the P value of “protein folding” is zero, indicating it is highly significant, while the P value of “signal transduction” is higher than the usual .05 significance threshold, showing it is not significant. This illustrates the fact that the number of genes in a given category cannot be used to assess its significance. This analysis was performed with Onto-Express (http://vortex.cs.wayne.edu).

Comment in

References

    1. Schena M, Shalon D, Davis RW, Brown PO. Quantitative monitoring of gene expression patterns with a complementary DNA microarray. Science. 1995;270:467–70. - PubMed
    1. Schena M. Microarray biochip technology. Eaton Publishing; Sunnyvale, CA: 2000.
    1. Aguan K, Carvajal JA, Thompson LP, Weiner CP. Application of a functional genomics approach to identify differentially expressed genes in human myometrium during pregnancy and labour. Mol Hum Reprod. 2000;6:1141–5. - PubMed
    1. Berchuck A, Iversen ES, Lancaster JM, Dressman HK, West M, Nevins JR, et al. Prediction of optimal versus suboptimal cytoreduction of advanced-stage serous ovarian cancer with the use of microarrays. Am J Obstet Gynecol. 2004;190:910–25. - PubMed
    1. Bethin KE, Nagai Y, Sladek R, Asada M, Sadovsky Y, Hudson TJ, et al. Microarray analysis of uterine gene expression in mouse and human pregnancy. Mol Endocrinol. 2003;17:1454–69. - PubMed

Publication types