. 2006 Aug 15;45(32):9675-87.
doi: 10.1021/bi060993z.

A new paradigm for DNA polymerase specificity

Affiliations

A new paradigm for DNA polymerase specificity

Yu-Chih Tsai et al. Biochemistry. .

Abstract

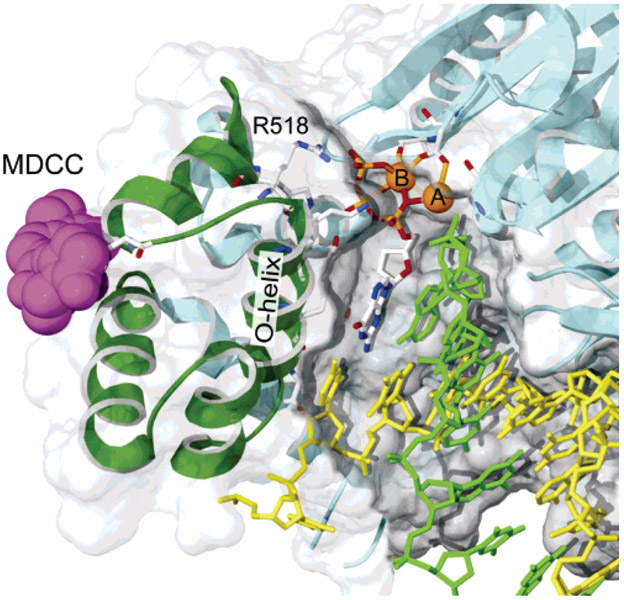
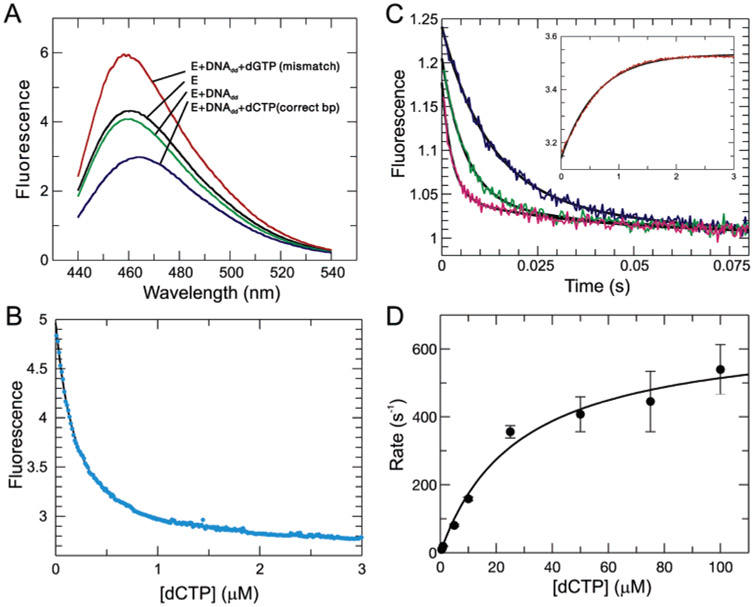
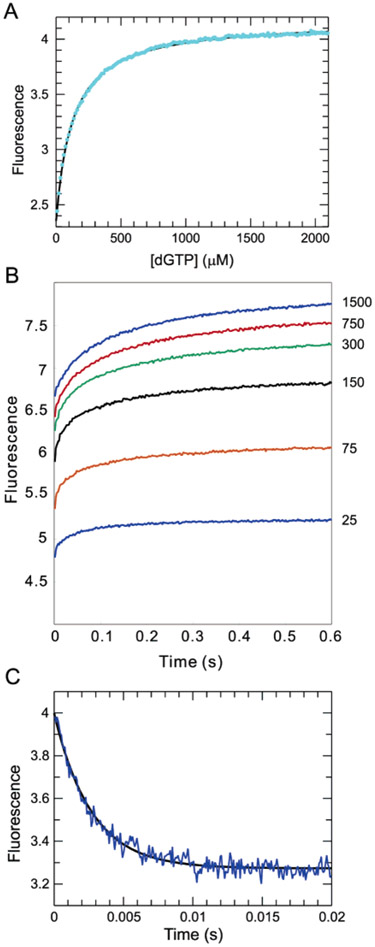
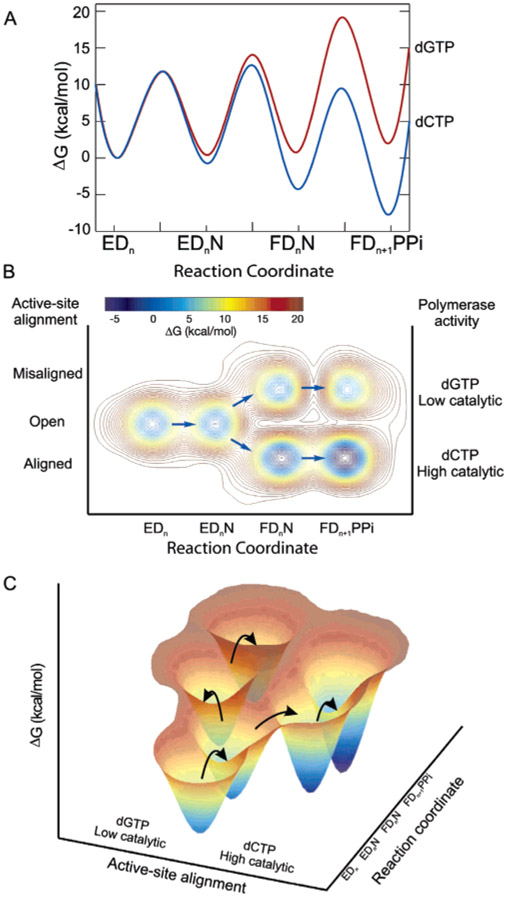
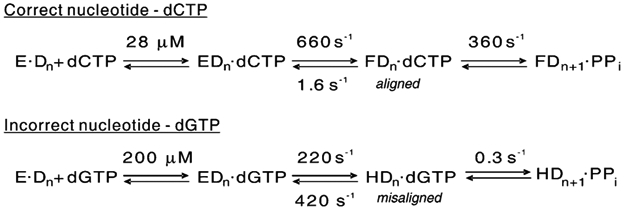
We show that T7 DNA polymerase exists in three distinct structural states, as reported by a conformationally sensitive fluorophore attached to the recognition (fingers) domain. The conformational change induced by a correct nucleotide commits the substrate to the forward reaction, and the slow reversal of the conformational change eliminates the rate of the chemistry step from any contribution toward enzyme specificity. Discrimination against mismatches is enhanced by the rapid release of mismatched nucleotides from the ternary E.DNA.deoxynucleoside triphosphate complex and by the use of substrate-binding energy to actively misalign catalytic residues to reduce the rate of misincorporation. Our refined model for enzyme selectivity extends traditional thermodynamic formalism by including substrate-induced structural alignment or misalignment of catalytic residues as a third dimension on the free-energy profile and by including the rate of substrate dissociation as a key kinetic parameter.


Figures

Figure 1:
Figure 1:
CSF probe labeling. The structure of T7 DNA polymerase is shown with MDCC docked at the position expected for the labeling of C514. The thumb and thioredoxin-binding domain (residues 233–411) and primer binding loop (residues 436–454) have been removed to reveal the active site. From PDB 1T7P (14), a cys-light mutant was constructed by removing 8 of the 10 cysteines (C20S–C88A–C275A–C313A–C451S–C660A–C688A–C703A) and introducing a single-surface-exposed cysteine (E514C) and was labeled overnight at 4 °C with a 20-fold molar excess of MDCC. Only residue 514 was labeled, and 90% efficiency was achieved.
Figure 2:
Figure 2:
Burst kinetics of the MDCC-labeled mutant T7 DNA polymerase. The time dependence of nucleotide incorporation was examined using quench-flow methods to evaluate the effects of the mutations and MDCC-labeling on the polymerase activity. (A) Amount of active enzyme after MDCC labeling was determined by an active-site titration experiment. The enzyme (200 nM, determined by a Bio-Rad protein assay with BSA standards) was preincubated with different amounts of DNA substrate. The reactions were then started by mixing the complex with 200 μM dCTP and were quenched after 18 ms. The amount of product formed as a function of the DNA concentration was fitted to a quadratic equation, ((E0 + Kd + DNA) − ((E0 + Kd + DNA)2 − (4E0DNA))0.5)/2, to obtain the active enzyme concentration, E0 = 92 ± 2.0 nM (92% active) and the dissociation constant for DNA binding, Kd = 36 ± 5.7 nM. (B) Nucleotide concentration dependence of the rate of polymerization was obtained by mixing a preformed enzyme–DNA complex (100 nM enzyme and 300 nM DNA after mixing) with various concentrations of dCTP. At each concentration, the time dependence of product formation was fit to a burst equation ([product] = A(1 – exp(−k1t)) + k2t) by nonlinear regression to derive the rate and amplitude of product formation. The concentration dependence of the rate of product formation (shown) was fit to a hyperbolic equation ([rate] = (kpolKd)/(Kd + S)) to yield the smooth line defining a maximal burst rate of kpol = 234 ± 9.4 s−1 for dCTP incorporation and an apparent Kd = 24 ± 3.1 μM.
Figure 3:
Figure 3:
Equilibrium and kinetics of the fluorescence changes resulting from nucleotide binding. (A) Fluorescence emission spectrum of the MDCC-labeled enzyme at different substrate-bound states is shown. The excitation wavelength was 425 nm. (B) Equilibrium titration experiment for dCTP binding was performed using a KinTek TMX titration module (www.kintek-corp.com) with a 200 nM enzyme–DNA complex. A dissociation constant of 140 ± 0.1 nM was determined by fitting the data to a quadratic equation by nonlinear regression (smooth line). (C) Stopped-flow fluorescence transients induced by dCTP binding: blue, 5 μM dCTP; green, 10 μM dCTP; and magenta, 25 μM dCTP. Each trace was fitted to a double-exponential function by nonlinear regression (smooth line); the fast phase defined the rate of the reaction, while the slow phase corrected for a small drop in intensity. (inset) Rate of release of dCTP follows a single-exponential transition with a rate of 1.6 ± 0.01 s−1. (D) Rates of dCTP-induced conformational change were determined at various dCTP concentrations. Fitting the rates as a function of dCTP concentrations to a hyperbolic equation yielded a maximum rate of 660 ± 52 s−1 and a ground-state Kd of 28 ± 6.2 μM.
Figure 4:
Figure 4:
Equilibrium and kinetics of the fluorescence changes following incorrect nucleotide binding. (A) Equilibrium titration data follow a hyperbolic curve with a Kd of 130 ± 0.8 μM. (B) Stopped-flow fluorescence traces corresponding to the binding of dGTP at concentrations ranging from 25 to 1500 μM. The data could be fitted globally with three isomerization steps with forward/ reverse rates of 220/420, 30/100, and 12/7, respectively, but this fit is not unique and is not shown. Rather, the minimal model with a single isomerization is shown in Scheme 1. (C) Rate of nucleotide release from a mismatched ternary complex was measured by chasing the release of the mismatch with the correct nucleotide. The E•DNAdd•dGTP complex (200 nM) was formed with 250 μM dGTP and then mixed with 2 mM dCTP. The fluorescence transition shows a single-exponential decay with a rate of 372 ± 5.4 s−1.
Figure 5:
Figure 5:
Free-energy profiles for the T7 DNA polymerase. (A) Conventional free-energy diagram for correct (dCTP) and mismatched (dGTP) nucleotide incorporation reactions. The free energy was calculated as ΔG = RT[ln(kT/h) − ln(kobs)] kcal/mol using rate constants from Scheme 1. The constant k is the Boltzmann constant, T is 293 K, h is Planck’s constant, and kobs is the firstorder rate constant. The nucleotide concentration was set equal to 100 μM. (B) Proposed three-dimensional free-energy diagram taking conclusions from our fluorescence studies into account. The diagram includes the alignment of active-site residues as a third axis. (C) Three-dimensional presentation of our proposed reaction free-energy profile for correct and incorrect nucleotide incorporations.
Scheme 1
Scheme 1

References

    1. Fersht A (1998) Structure and Mechanism in Protein Science: A Guide to Enzyme Catalysis and Protein Folding, W. H. Freeman and Company, New York.
    1. Fersht A (1985) Enzyme Structure and Mechanism, W. H. Freeman and Company, New York.
    1. Fersht AR (1974) Catalysis, binding and enzyme-substrate complementarity, Proc. R. Soc. London, Ser. B 187, 397–407. - PubMed
    1. Post CB, and Ray WJ Jr. (1995) Re-examination of induced fit as a determinant of substrate specificity in enzymatic reactions, Biochemistry 34, 15881–15885. - PubMed
    1. Johnson KA (1993) Conformational coupling in DNA polymerase fidelity, Annu. Rev. Biochem 62, 685–713. - PubMed

Publication types

Substances