

Estimation of European wild boar relative abundance and aggregation: a novel method in epidemiological risk assessment
- PMID: 16893488
- PMCID: PMC2870594
- DOI: 10.1017/S0950268806007059
Estimation of European wild boar relative abundance and aggregation: a novel method in epidemiological risk assessment
Abstract
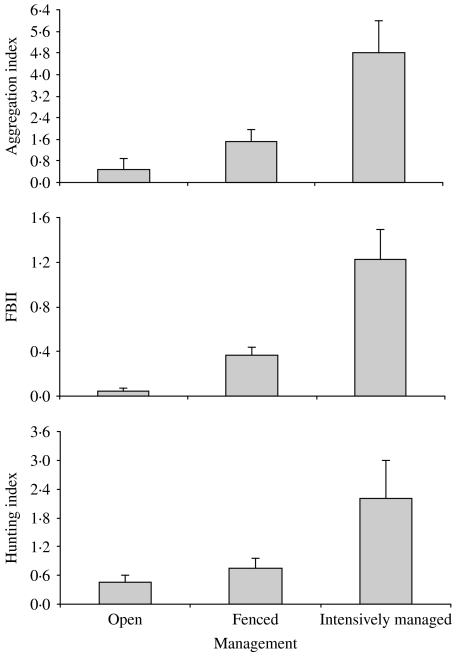
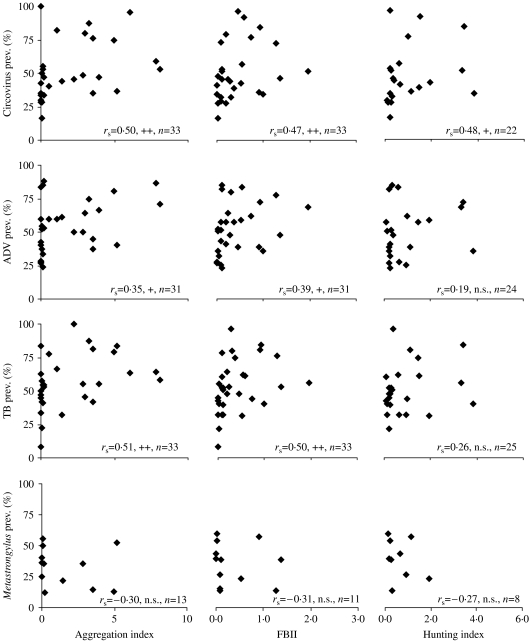
Wild boars are important disease reservoirs. It is well known that abundance estimates are needed in wildlife epidemiology, but the expense and effort required to obtain them is prohibitive. We evaluated a simple method based on the frequency of faecal droppings found on transects (FBII), and developed a spatial aggregation index, based on the runs test statistic. Estimates were compared with hunting data, and with porcine circovirus and Aujeszky's disease virus seroprevalences and Mycobacterium tuberculosis complex and Metastrongylus spp. prevalence. The FBII and the aggregation index were correlated with the hunting index, but both of the former estimates correlated better than the latter with the disease prevalences. Hence, at least in habitats with high wild boar densities, the FBII combined with the aggregation index constitutes a cheap and reliable alternative for wild boar abundance estimation that can be used for epidemiological risk assessment, even outside the hunting season and in areas with no available data on hunting activities.
Figures
References
-
- Sáez-Royuela C, Tellería JL. The increased population of wild boar (Sus scrofa) in Europa. Mammal Review. 1986;16:97–101.
-
- Cargnelutti B, Spitz F, Valet G. Analysis of the dispersion of wild boar (Sus scrofa) in southern France. Ongules/Ungulates. 1992;91:423–425.
-
- Gipson P, Hlavachick B, Berger T. Range expansion by wild hogs across the central United States. Wildlife Society Bulletin. 1998;26:279–286.
-
- Rosell C, Herrero J., Palomo LJ, Gisbert J.Sus scrofaAtlas de los Mamíferos Terrestres de España Madrid: SECEM – SECEMU; 2002306–309.
-
- Gortazar C et al. Historical examination of the status of large mammals in Aragon, Spain. Mammalia. 2000;64:411–422.
Publication types
MeSH terms
LinkOut - more resources
Full Text Sources
Miscellaneous
