. 2006 Nov 10;281(45):33835-41.
doi: 10.1074/jbc.M603248200. Epub 2006 Aug 7.

Requirement of transmembrane transport for S-nitrosocysteine-dependent modification of intracellular thiols

Affiliations

Requirement of transmembrane transport for S-nitrosocysteine-dependent modification of intracellular thiols

Katarzyna A Broniowska et al. J Biol Chem. .

Abstract

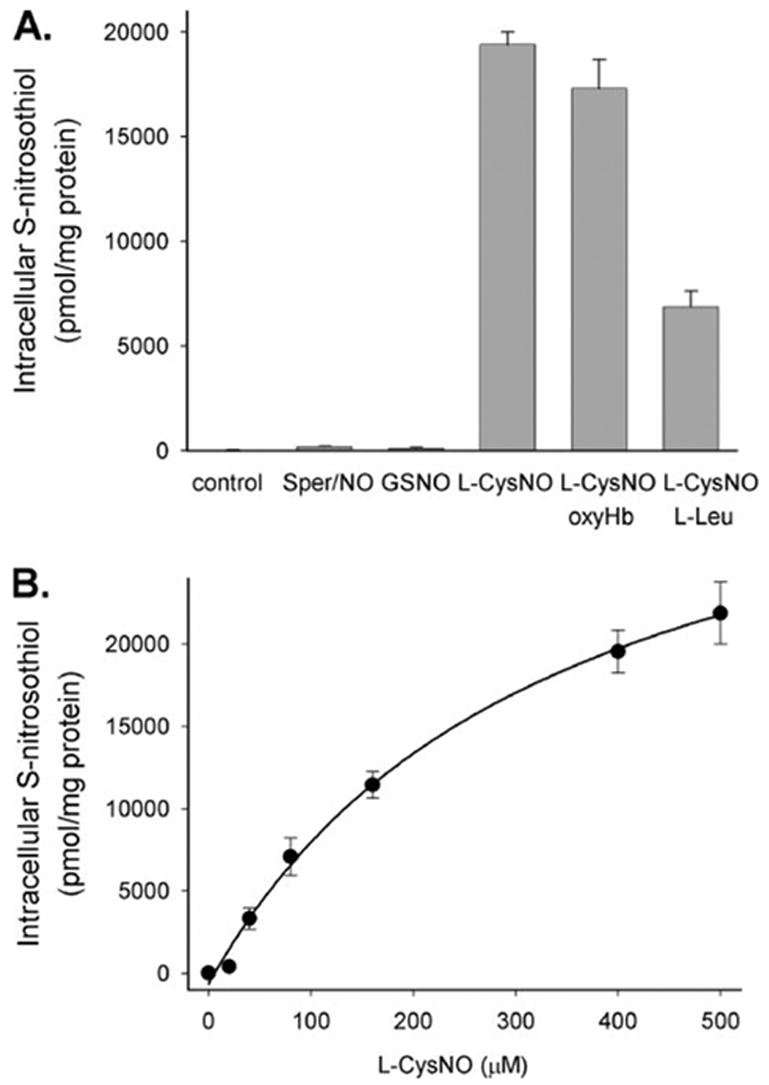
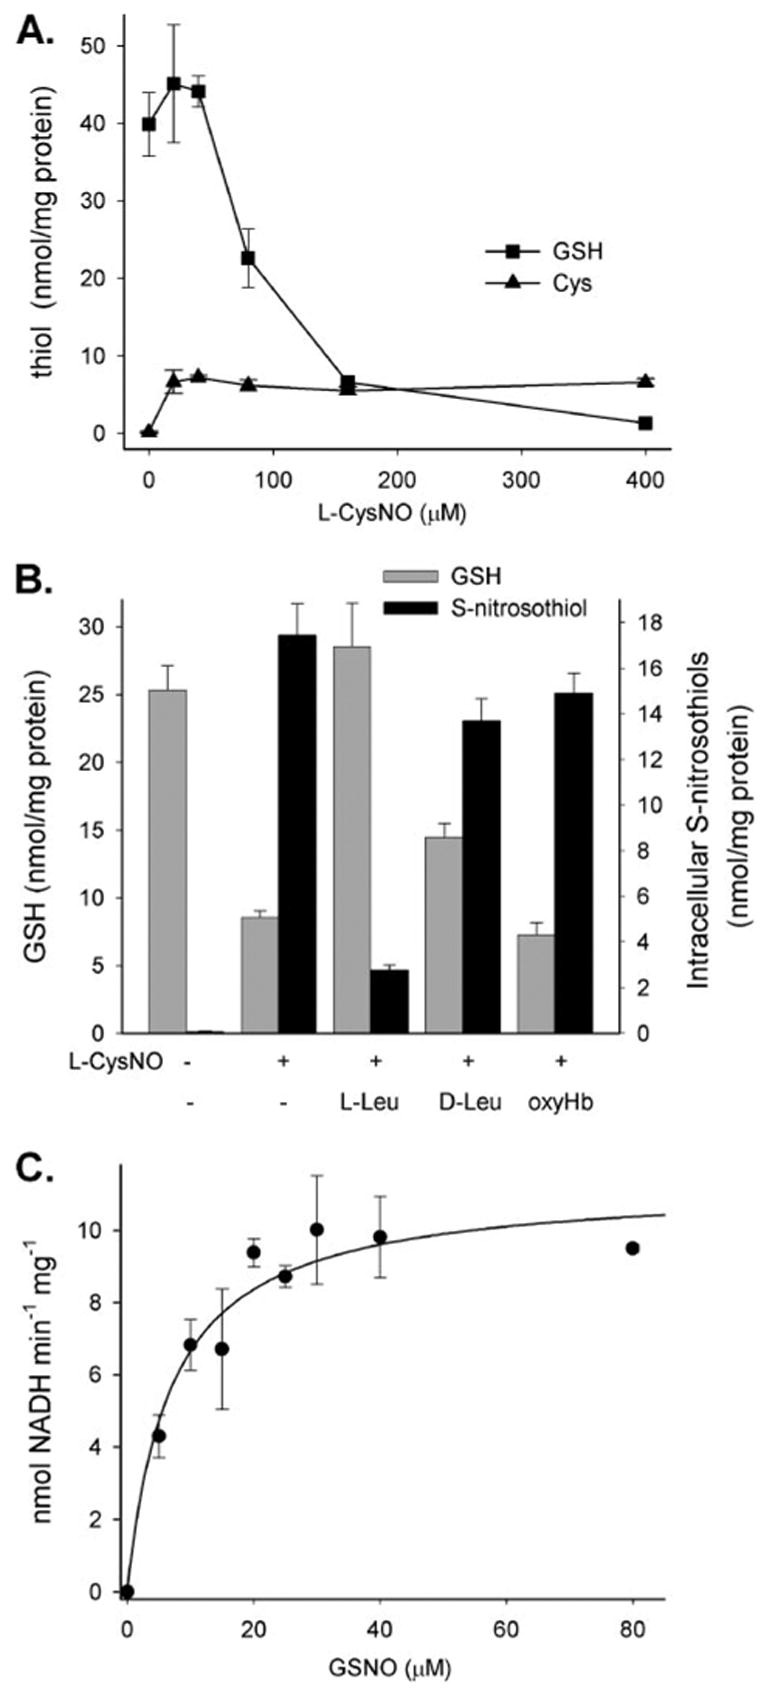
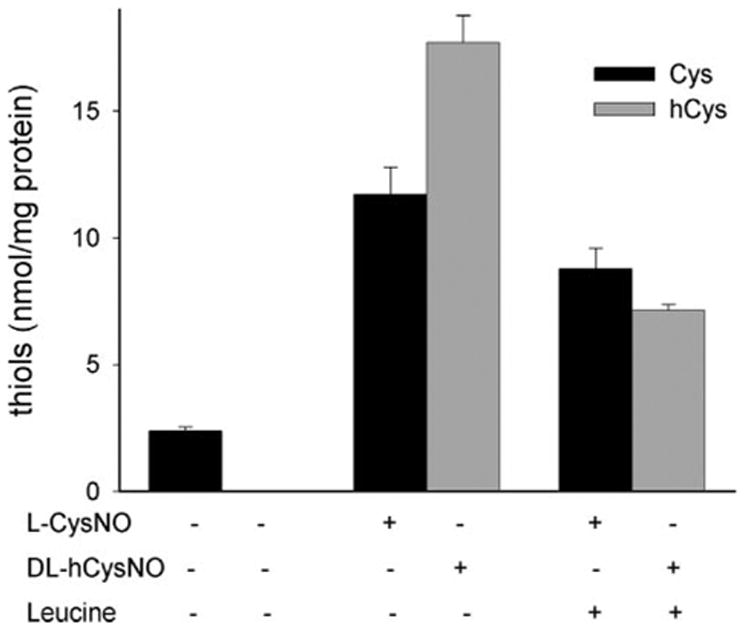
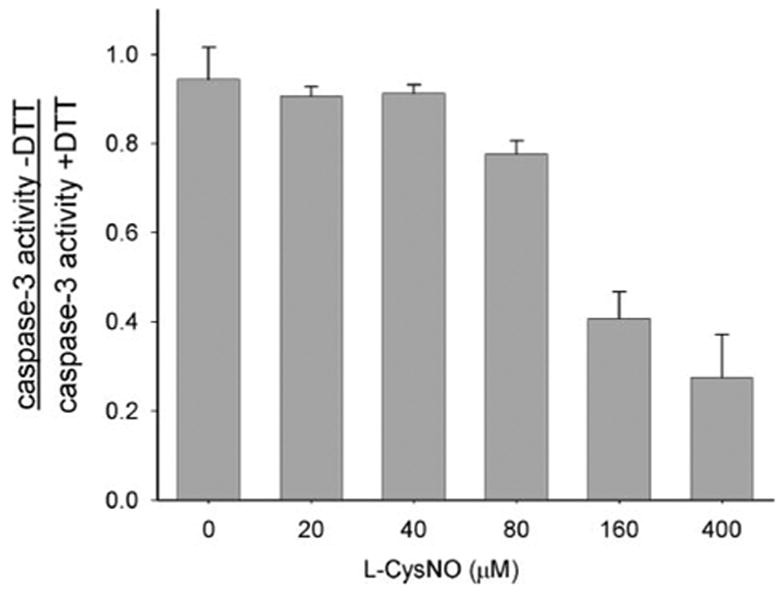
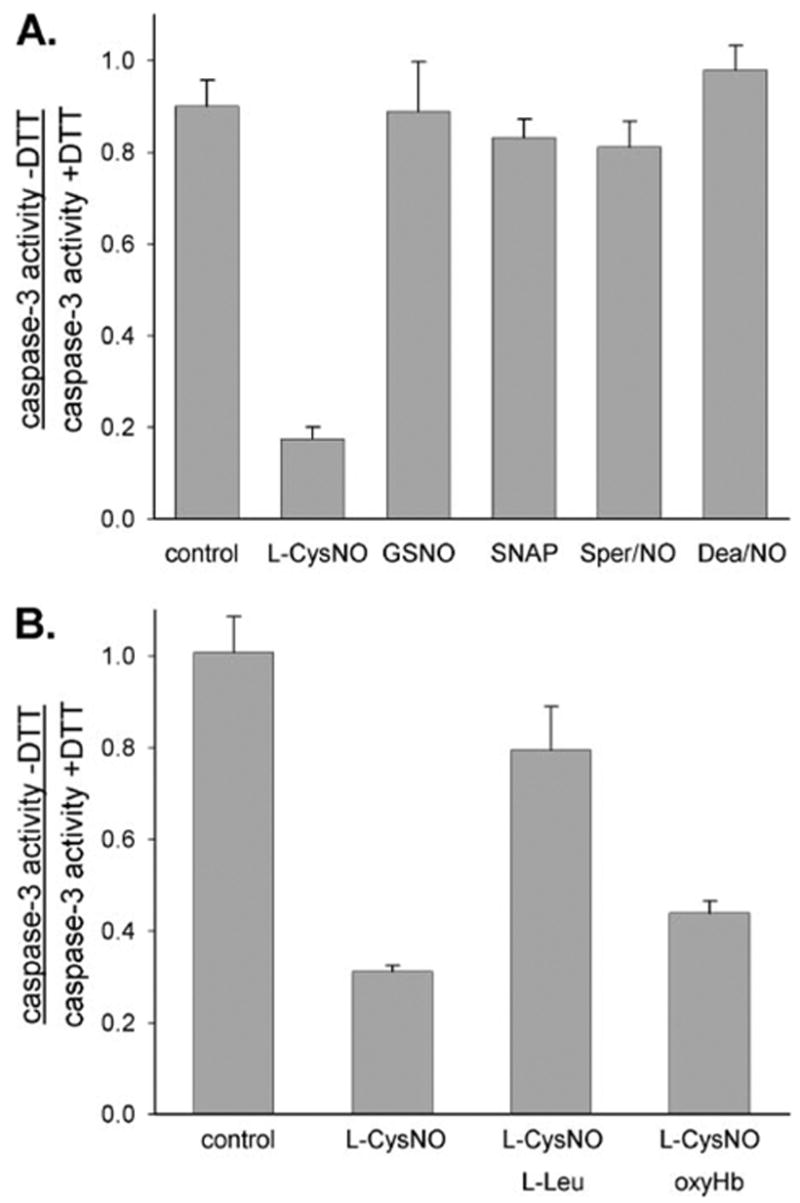
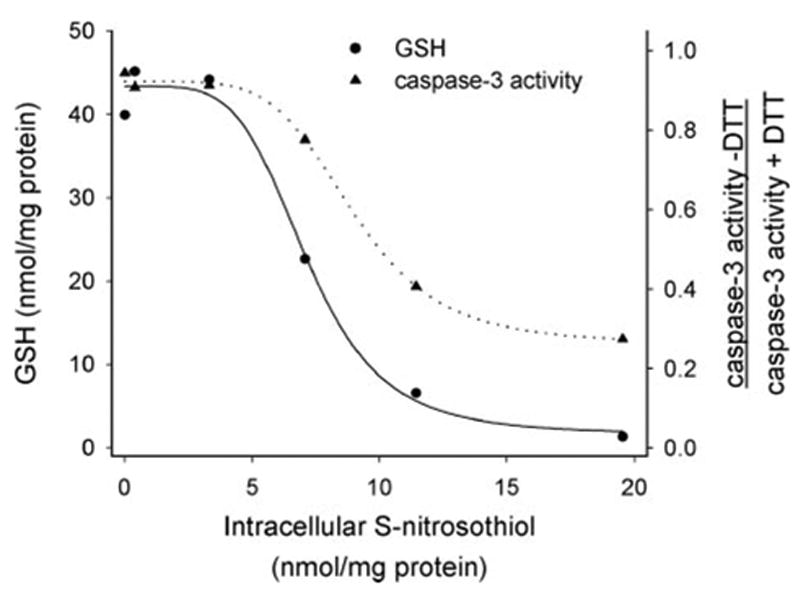
S-nitrosothiols have been implicated as intermediary transducers of nitric oxide bioactivity; however, the mechanisms by which these compounds affect cellular functions have not been fully established. In this study, we have examined the effect of S-nitrosothiol transport on intracellular thiol status and upon the activity of a target protein (caspase-3), in bovine aortic endothelial cells. We have previously demonstrated that the specific transport of amino acid-based S-nitrosothiols (S-nitroso-L-cysteine and S-nitrosohomocysteine) occurs via amino acid transport system L to generate high levels of intracellular protein S-nitrosothiols (Zhang, Y., and Hogg, N. (2004) Proc. Natl. Acad. Sci. U. S. A. 101, 7891-7896). In this study, we demonstrate that the transport of S-nitrosothiols is essential for these compounds to affect intracellular thiol levels and to modify intracellular protein activity. Importantly, the ability of these compounds to affect intracellular processes occurs independently of nitric oxide formation. These findings suggest that the major action of these compounds is not to liberate nitric oxide in the extracellular space but to be specifically transported into cells where they are able to modify cellular functions through nitric oxide-independent mechanisms.


Figures

FIGURE 1
FIGURE 1. Intracellular RSNO formation after exposure of BAECs to NO and RSNO
A, BAECs were treated with Sper/NO (400 μM), GSNO (400 μM), or L-CysNO (160 μM) for 60 min in HBSS. In the case of L-CysNO, cells were coin-cubated with or without oxyHb (160 μM) or L-Leu (8 mM), a NO scavenger and L-AT competitor, respectively. B, BAECs were treated with various concentrations of L-CysNO for 60 min in HBSS. Intracellular RSNO levels were measured by chemiluminescence. Data were normalized to protein concentration and represent mean ± S.E. (n = 3).
FIGURE 2
FIGURE 2. Intracellular thiol levels after exposure of BAEC to L-CysNO and the metabolism of GSNO by BAEC lysate
A, BAECs were treated with L-CysNO for 60 min in HBSS. GSH (squares) and cysteine (triangles) levels in cell lysates were determined by HPLC. Data were normalized to protein concentration and represent mean ± S.E. (n = 3). B, BAECs were treated with L-CysNO (160 μM) in the absence or presence of L-AT competitors (L-leucine, D-leucine, 8 mM) and NO scavenger oxyHb (160 μM). GSH level (gray bars) in cell lysates was determined by HPLC, and RSNO levels (black bars) were measured by chemiluminescence. Data were normalized to protein concentration and represent mean ± S.E. (n = 3). C, the rate of NADH (200 μM) consumption at varying concentrations of GSNO was measured as a decrease in absorption at 340 nm. The initial velocity of reaction was calculated as nmol NADH/min/mg of protein. A rectangular hyperbola was fitted to the data points (solid line). The data represent mean ± S.E. (n = 3).
FIGURE 3
FIGURE 3. Effect of RSNO treatment on intracellular thiol levels
BAECs were treated with L-CysNO (160 μM) or DL-hCysNO (160 μM) in the absence or presence of the L-AT competitor, L-leucine (8 mM). Cysteine (black bars) and homocysteine (gray bars) levels in cell lysates were determined by HPLC. Data were normalized to protein concentration and represent mean ± S.E. (n = 3).
FIGURE 4
FIGURE 4. Concentration-dependent effects of CysNO on caspase-3-like activity
BAECs were incubated with doxorubicin (0.5 μM) for 8 h in medium to induce caspase-3 activity. Cells were washed and incubated for a further 1 h with L-CysNO in HBSS. The caspase-3-like activity was determined in cell lysate in the presence and absence of DTT and expressed as the ratio of caspase-3 activity − DTT:caspase-3 activity + DTT. Caspase-3 activity for untreated cells was 6.8 ± 0.2 pmol of AMC/mg/min (with DTT) and 6.3 ± 0.3 pmol of AMC/mg/min (without DTT); caspase-3 activity for cells treated only with doxorubicin (control) was 122.0 ± 10.0 pmol of AMC/mg/min (with DTT) and 115.2 ± 2.0 pmol of AMC/mg/min (without DTT). The data represent mean ± S.E. (n = 3).
FIGURE 5
FIGURE 5. Effects of CysNO transport on caspases-3-like activity
BAECs were incubated with doxorubicin (0.5 μM) for 8 h in medium to induce caspase-3 activity. A, cells were washed and incubated for a further 1 h with various low molecular weight RSNOs (400 μM) and NO donors (400 μM). Caspase-3-like activity was determined in the cell lysates in the presence and absence of DTT and expressed as the ratio caspase-3 activity − DTT:caspase-3 activity + DTT. Caspase-3 activity for untreated cells was 4.3 ± 0.1 pmol of AMC/mg/min (with DTT) and 3.0 ± 0.23 pmol of AMC/mg/min (without DTT); caspase-3 activity for cells treated only with doxorubicin (control) was 115.8 ± 5.8 pmol of AMC/mg/min (with DTT) and 102.0 ± 3.7 pmol of AMC/mg/min (without DTT). The data represent mean ± S.E. (n = 3). B, cells were washed and incubated for a further 1 h with L-CysNO (160 μM) in the absence or presence of L-Leu (8 mM) or oxyHb (160 μM). The caspase-3-like activity was determined in the cell lysates in the presence or absence of DTT and expressed as the ratio caspase-3 activity − DTT:caspase-3 activity + DTT. Caspase-3 activity for untreated cells was 4.6 ± 0.2 pmol of AMC/mg/min (with DTT) and 4.6 ± 0.1 pmol of AMC/mg/min (without DTT); caspase-3 activity for cells treated only with doxorubicin (control) was 99.6 ± 6.2 pmol of AMC/mg/min (with DTT) and 99.4 ± 1.5 pmol of AMC/mg/min (without DTT). The data represent mean ± S.E. (n = 3).
FIGURE 6
FIGURE 6. GSH depletion and caspase-3 activity as a function of intracellular RSNO level
Data from Figs. 1B, 2A, and 4 were replotted to show the depletion of GSH and the increase in the reversible inhibition of caspase-3 activity as a function of the level of intracellular RSNO.

References

    1. Stamler JS, Jaraki O, Osborne J, Simon DI, Keaney J, Vita J, Singel D, Valeri CR, Loscalzo J. Proc Natl Acad Sci U S A. 1992;89:7674–7677. - PMC - PubMed
    1. Bryan NS, Rassaf T, Maloney RE, Rodriguez CM, Saijo F, Rodriguez JR, Feelisch M. Proc Natl Acad Sci U S A. 2004;101:4308–4313. - PMC - PubMed
    1. Zhang Y, Hogg N. Am J Physiol. 2004;287:L467–L474. - PubMed
    1. Crawford JH, Chacko BK, Pruitt HM, Piknova B, Hogg N, Patel RP. Blood. 2004;104:1375–1382. - PubMed
    1. Jourd’heuil D, Gray L, Grisham MB. Biochem Biophys Res Commun. 2000;273:22–26. - PubMed

Publication types