. 2006 Aug 14;174(4):499-508.
doi: 10.1083/jcb.200605074. Epub 2006 Aug 7.

Meiotic cohesins modulate chromosome compaction during meiotic prophase in fission yeast

Affiliations

Meiotic cohesins modulate chromosome compaction during meiotic prophase in fission yeast

Da-Qiao Ding et al. J Cell Biol. .

Abstract

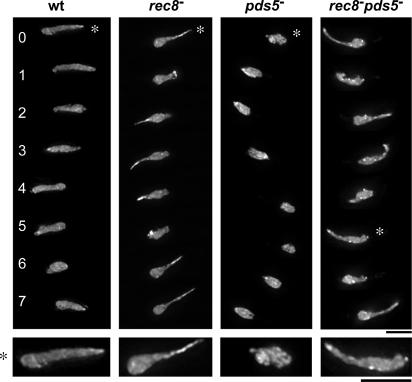
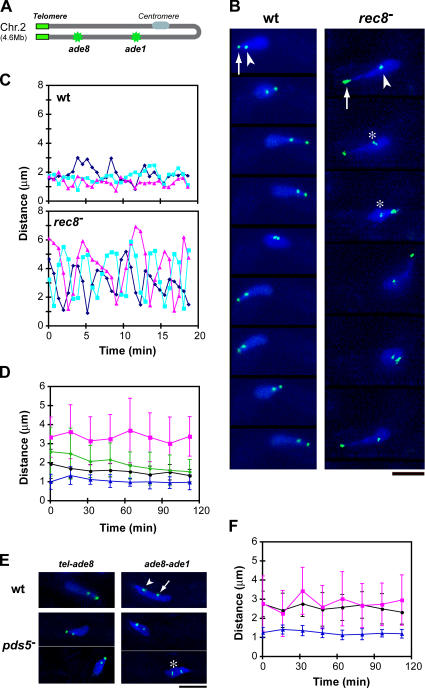
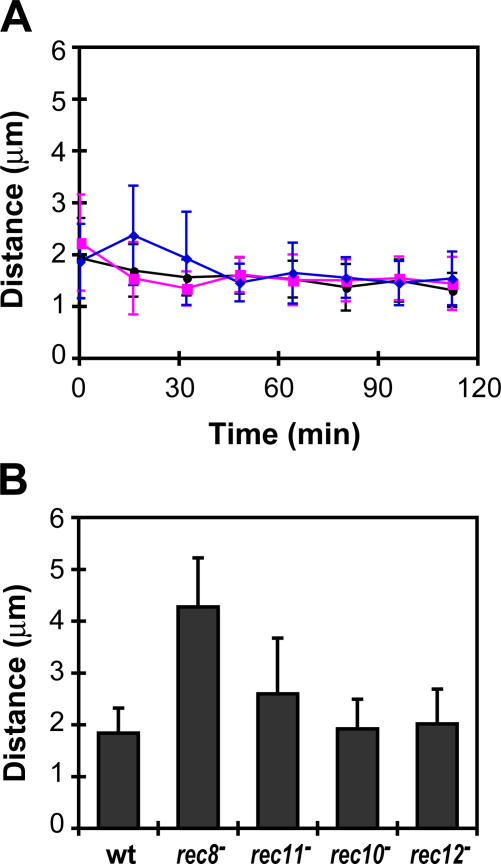
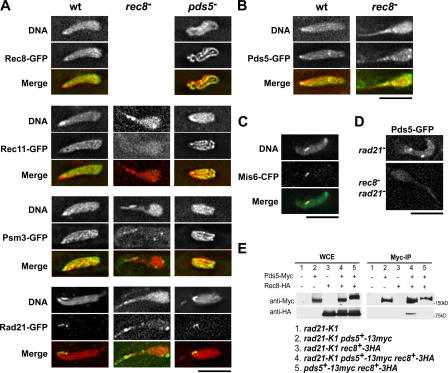
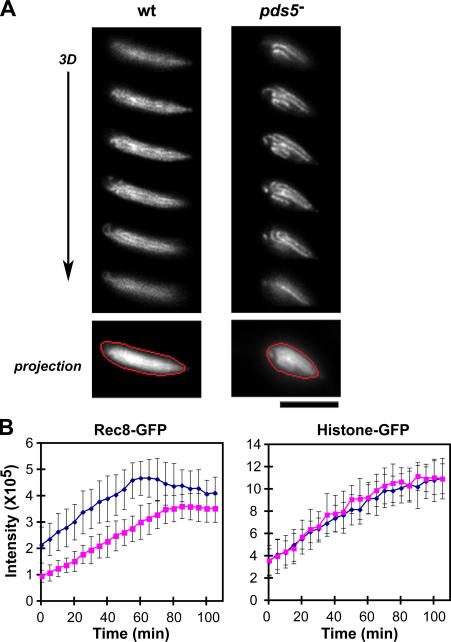
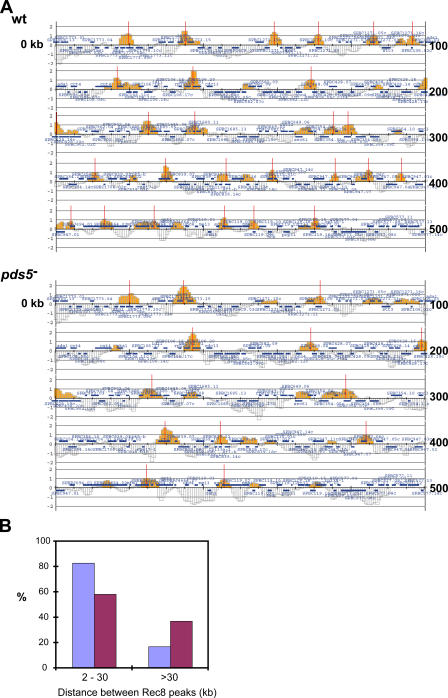
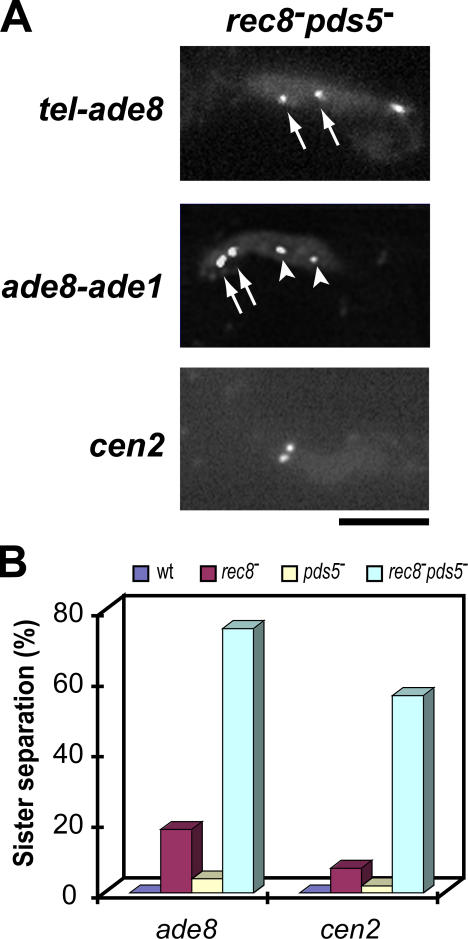
The meiotic cohesin Rec8 is required for the stepwise segregation of chromosomes during the two rounds of meiotic division. By directly measuring chromosome compaction in living cells of the fission yeast Schizosaccharomyces pombe, we found an additional role for the meiotic cohesin in the compaction of chromosomes during meiotic prophase. In the absence of Rec8, chromosomes were decompacted relative to those of wild-type cells. Conversely, loss of the cohesin-associated protein Pds5 resulted in hypercompaction. Although this hypercompaction requires Rec8, binding of Rec8 to chromatin was reduced in the absence of Pds5, indicating that Pds5 promotes chromosome association of Rec8. To explain these observations, we propose that meiotic prophase chromosomes are organized as chromatin loops emanating from a Rec8-containing axis: the absence of Rec8 disrupts the axis, resulting in disorganized chromosomes, whereas reduced Rec8 loading results in a longitudinally compacted axis with fewer attachment points and longer chromatin loops.


Figures

Figure 1.
Figure 1.
Morphology of the horsetail nucleus in meiotic cohesin mutants. Time-lapse images of nuclear movements in wild-type, rec8 , pds5 , and rec8 pds5 cells are shown. Chromosomes were stained with histone H3-GFP. The bottom panels are twofold-enlarged images of the nuclei indicated by asterisks. Bars, 5 μm.
Figure 2.
Figure 2.
Meiotic prophase chromosome compaction. (A) Schematic drawing showing the position of lacO inserts (green) in chromosome II with the telomeres clustered. (B) Time-lapse images of living wild-type and rec8 cells. DNA was stained with Hoechst 33342 (blue). Green spots represent telomeres stained with Taz1-GFP (arrows) and the ade8 locus stained with lacO/lacI-GFP (arrowheads). Slight separation of sister chromatid loci is seen in the rec8 cell (asterisks). (C) Distance between the telomere and the ade8 locus in examples of three individual cells. Time 0 represents the start of observations. (D) Changes in the telomere to ade8 distance during meiotic prophase in wild-type (black circle), rec8 cells (magenta square), rec11 cells (green diamond), and pds5 cells (blue triangle). The distance was measured during a 2-min period every 15 min: values were obtained only when the nucleus was moving straight in either direction (not making a turn) and averaged from 10–20 measurements from 10 cells at each time point. The error bars indicate standard deviations. Time 0 represents the start of meiotic prophase, when karyogamy has just finished. (E) Chromosome compaction in pds5 mutants. DNA was stained with Hoechst 33342 (blue). The green spots in left panels are telomeres and the ade8 locus, as in B. The green spots in the right panels are the ade8 locus (arrowhead) and the ade1 locus (arrow). Slight separation of sister chromatid loci in a pds5 cell is indicated by an asterisk. (F) Changes in the ade8 to ade1 distance during meiotic prophase in wild-type (black circle), rec8 cells (magenta square), and pds5 cells (blue triangle). Bars, 5 μm.
Figure 3.
Figure 3.
Chromosome compaction at anaphase. Anaphase chromosomes in mitosis (A) and meiosis I (B). Two lacO arrays were inserted on one of the arms of chromosome I at lys1 (arrows) and ade3 (arrowheads) loci and stained with lacI-GFP (schematic drawing). Data in Table II were collected only from cells in early anaphase: when the spindle elongation was ongoing and nuclear separation was not complete (second panel). Bars, 5 μm.
Figure 4.
Figure 4.
Chromosome compaction in recombination mutants during meiotic prophase. (A) Changes in the telomere to ade8 distance during meiotic prophase in wild-type (black circle), rec10 (magenta square), and rec12 cells (blue diamond). (B) The mean telomere to ade8 distances in wild-type cells and mutants during meiotic prophase. The means were calculated from 140 to 190 measurements from time-lapse series of 15–20 cells per strain; the error bars represent the standard deviation. The difference between the wild-type and rec8 or rec11 mutants is significant (P < 0.0001), as detected by a t test.
Figure 5.
Figure 5.
Localization and interaction of cohesins and Pds5 in the meiotic prophase nucleus. (A) Localization of Rec8-, Rec11-, Psm3-, and Rad21-GFP in rec8 and pds5 mutants. The rec8 has no Rec8-GFP. (B) Localization of Pds5-GFP in wild-type and rec8 cells. In both A and B, DNA was stained with Hoechst 33342; red represents DNA and green represents GFP in the merged images. (C) Double staining of Pds5-GFP (green in merged image) and Mis6-CFP (red in merged image) in a wild-type cell. (D) Localization of Pds5-GFP in the rad21-K1 mutant and the rec8 rad21-K1 double mutant at 31°C. (E) Immunoprecipitation of Pds5-13Myc and Rec8-3HA in mitotic cells. Immunoprecipitation was performed with anti-Myc mouse antibody. Proteins from whole cell extracts and from precipitates were electrophoresed and immunoblotted with anti-HA and anti-myc antibodies. Bars, 5 μm.
Figure 6.
Figure 6.
Quantitative analysis of the fluorescent intensity of Rec8- and histone-GFP in the nucleus in meiotic prophase. (A) Images of Rec8-GFP are shown in 3D focal planes, with an additive projection image (bottom). The red polygons represent the satisfactory polygon defined by the 2D Polygon Finder of the SoftWoRx imaging analysis software. (B) Changes in intensity of Rec8- and histone H3-GFP signals in nuclei of wild-type (blue) and pds5 mutant (magenta) cells during meiotic prophase. The data presented are means from 19 cells for Rec8-GFP and 14 cells for histone H3-GFP. The error bars represent the standard deviation. Time 0 represents the start of meiotic prophase, when karyogamy has just finished. Bar, 5 μm.
Figure 7.
Figure 7.
Rec8 binding on chromosomes in wild-type and pds5 mutant cells. ChIP was performed against Rec8-HA in pat1-114 synchronized meiosis after the temperature was shifted up to 34°C for 3 h. The premeiotic DNA synthesis was complete at this time (Fig. S4, available at http://www.jcb.org/cgi/content/full/jcb.200605074/DC1). (A) Enrichment in the immunoprecipitated fraction relative to a whole genome DNA sample is shown along a 500-kb region at left arm of chromosome II. Each bar represents the mean of 11 oligonucleotide probes within adjacent 250-bp windows. Orange bars represent significant binding. Blue bars above and below the midline indicate open reading frames transcribed from left to right and from right to left, respectively. The y-axis scale is log2. The Rec8 binding sites (red lines) were estimated using a threshold of above 0.8 for peak height and 2 kb for width. (B) Distribution of distance between neighboring Rec8 binding sites on chromosome II and III. Centromere regions were excluded from this analysis. Data are means of two independent experiments.
Figure 8.
Figure 8.
Sister chromatid cohesion in rec8 and pds5 mutants. (A) Precocious separation of sister chromatids in the rec8 pds5 double mutant. A pair of sister chromatid loci on one of the homologous chromosomes was marked with lacO/lacI-GFP: (top) Taz1-GFP and ade8 locus (arrows); (middle) ade1 (arrowheads) and ade8 loci (arrows); (bottom) cen2 locus. (B) Frequency of sister chromatid separation during meiotic prophase. A pair of sister chromatid loci on one of the homologous chromosomes was marked with lacO/lacI-GFP at the ade8 or cen2 locus. Bar, 5 μm.

References

    1. Bahler, J., T. Wyler, J. Loidl, and J. Kohli. 1993. Unusual nuclear structures in meiotic prophase of fission yeast: a cytological analysis. J. Cell Biol. 121:241–256. - PMC - PubMed
    1. Bahler, J., J.Q. Wu, M.S. Longtine, N.G. Shah, A. McKenzie III, A.B. Steever, A. Wach, P. Philippsen, and J.R. Pringle. 1998. Heterologous modules for efficient and versatile PCR-based gene targeting in Schizosaccharomyces pombe. Yeast. 14:943–951. - PubMed
    1. Bannister, L.A., L.G. Reinholdt, R.J. Munroe, and J.C. Schimenti. 2004. Positional cloning and characterization of mouse mei8, a disrupted allelle of the meiotic cohesin Rec8. Genesis. 40:184–194. - PubMed
    1. Cervantes, M.D., J.A. Farah, and G.R. Smith. 2000. Meiotic DNA breaks associated with recombination in S. pombe. Mol. Cell. 5:883–888. - PubMed
    1. Chan, R.C., A.F. Severson, and B.J. Meyer. 2004. Condensin restructures chromosomes in preparation for meiotic divisions. J. Cell Biol. 167:613–625. - PMC - PubMed

Publication types

MeSH terms

Associated data