Ice-age endurance: DNA evidence of a white spruce refugium in Alaska
- PMID: 16894151
- PMCID: PMC1567899
- DOI: 10.1073/pnas.0605310103
Ice-age endurance: DNA evidence of a white spruce refugium in Alaska
Abstract
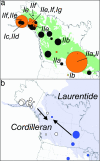
Paleorecords offer key information for evaluating model simulations of species migration in response to forecast climatic change. However, their utility can be greatly compromised by the existence of glacial refugia that are undetectable in fossil records (cryptic refugia). Despite several decades of investigation, it remains controversial whether Beringia, the largely unglaciated area extending from northeastern Siberia to the Yukon Territory, harbored small populations of certain boreal tree species during the last glaciation. Here, we present genetic evidence for the existence of a glacial refuge in Alaska that helps to resolve this long-standing controversy. We sequenced chloroplast DNA (cpDNA) of white spruce (Picea glauca), a dominant boreal tree species, in 24 forest stands across northwestern North America. The majority of cpDNA haplotypes are unique, and haplotype diversity is relatively high in Alaska, arguing against the possibility that this species migrated into the region from areas south of the Laurentide Ice Sheet after the end of the last glaciation. Thus, white spruce apparently survived long glacial episodes under climatic extremes in a heterogeneous landscape matrix. These results suggest that estimated rates of tree migration from fossil records may be too high and that the ability of trees to track anthropogenic warming may be more limited than previously thought.
Conflict of interest statement
Conflict of interest statement: No conflicts declared.
Figures


References
-
- Hultén E. Outline of the History of Arctic and Boreal Biota During the Quaternary Period. New York: Lehre J. Cramer; 1937.
-
- Brubaker L. B., Anderson P. M., Edwards M. E., Lozhkin A. V. J. Biogeogr. 2005;32:833–848.
-
- Colinvaux P. A. Ecol. Monogr. 1964;34:297–329.
-
- Hopkins D. M. Inter Nord. 1972;12:121–150.
-
- Hopkins D. M., Smith P. A., Matthews J. V., Jr. Quat. Res. 1981;15:217–249.
Publication types
MeSH terms
Substances
Associated data
- Actions
- Actions
- Actions
- Actions
- Actions
- Actions
- Actions
- Actions
- Actions
- Actions
- Actions
- Actions
- Actions
- Actions
- Actions
- Actions
- Actions
- Actions
- Actions
LinkOut - more resources
Full Text Sources

