. 2006 Jul;4(8):e252.
doi: 10.1371/journal.pbio.0040252.

An early role for WNT signaling in specifying neural patterns of Cdx and Hox gene expression and motor neuron subtype identity

Affiliations

An early role for WNT signaling in specifying neural patterns of Cdx and Hox gene expression and motor neuron subtype identity

Ulrika Nordström et al. PLoS Biol. 2006 Jul.

Abstract

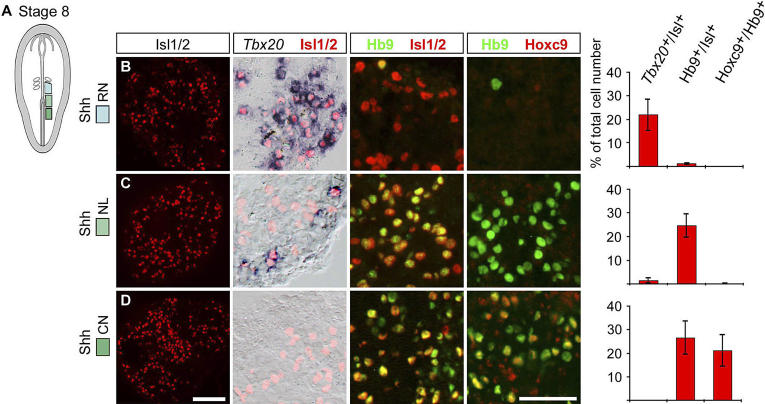
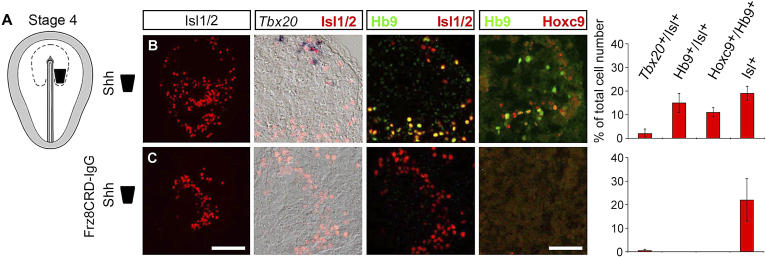
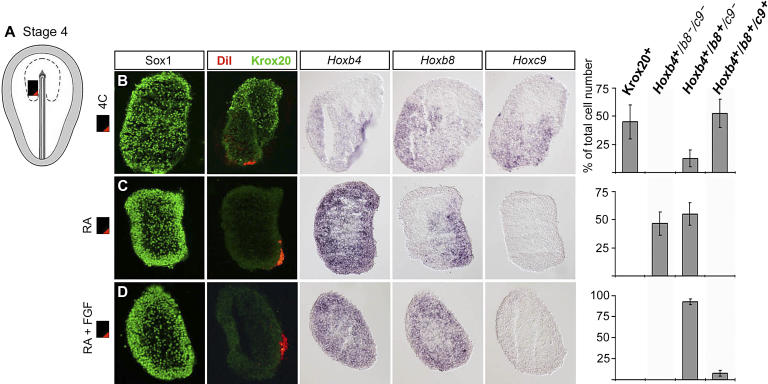
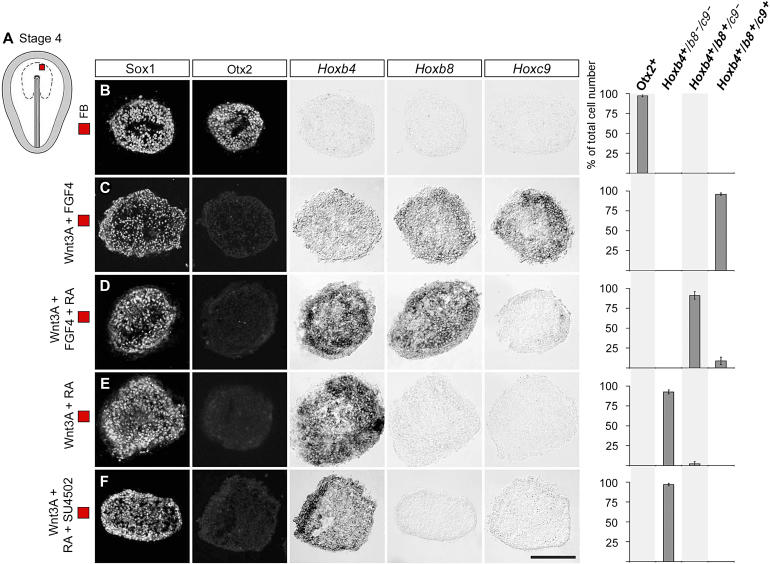
The link between extrinsic signaling, progenitor cell specification and neuronal subtype identity is central to the developmental organization of the vertebrate central nervous system. In the hindbrain and spinal cord, distinctions in the rostrocaudal identity of progenitor cells are associated with the generation of different motor neuron subtypes. Two fundamental classes of motor neurons, those with dorsal (dMN) and ventral (vMN) exit points, are generated over largely non-overlapping rostrocaudal domains of the caudal neural tube. Cdx and Hox genes are important determinants of the rostrocaudal identity of neural progenitor cells, but the link between early patterning signals, neural Cdx and Hox gene expression, and the generation of dMN and vMN subtypes, is unclear. Using an in vitro assay of neural differentiation, we provide evidence that an early Wnt-based program is required to interact with a later retinoic acid- and fibroblast growth factor-mediated mechanism to generate a pattern of Cdx and Hox profiles characteristic of hindbrain and spinal cord progenitor cells that prefigure the generation of vMNs and dMNs.


Figures

Figure 1
Figure 1. Profiles of Hox Gene Expression, dMNs, and vMNs in the Hindbrain and Spinal Cord
(A) Schematic figure of the caudal embryonic neural tube divided into four distinct regions along the rostrocaudal axis: rHB; r7 and r8 defined as cHB; the region of the spinal cord located at the level of somite 6–19 defined as the rSC; and the region located caudal to somite 19 defined as cSC. (B) In a stage 17 (30-somite) chick embryo, the rostral borders of Hoxb4, Hoxb8, and Hoxc9 expression are located just caudal to the otic vesicle (OV) (at the level of the r6/7 border), at the level of somite 5/6, and at the level of somite 19/20, respectively. Hoxb4 expression in the absence of Hoxb8 and Hoxc9 is characteristic of cells in the cHB (r7 and r8). Expression of Hoxb4 and Hoxb8 in the absence of Hoxc9 is characteristic of the rSC domain, and expression of Hoxb4, Hoxb8, and Hoxc9 is characteristic of cells in the cSC domain. (C) In stage 20 (42-somite) chick embryos, the rostral boundaries of expression of Hoxb4, Hoxb8, and Hoxc9 in the neural tube are maintained as in a stage 17 embryo (± 1-somite). Tbx20 +/Isl + dMNs are present at high numbers in the cHB and at lower numbers in the rSC. No Tbx20 +/Isl + dMNs are found in the cSC. In contrast, Hb9 +/Isl + vMNs are present at high numbers in both rSC and cSC, and at lower numbers in r8 of the cHB. Hoxc9 protein is expressed in a subset of Hb9 +/Isl + vMNs in the cSC and thus, distinguishes vMNs in the cSC from vMNs in the rSC. (D) Horizontal bars represent rostrocaudal restrictions (applied to Figure 1A) of marker genes expressed by neural progenitor cells in the stage 17 neural tube, and by MNs in stage 20 embryos.
Figure 2
Figure 2. Expression Pattern of CdxB and CdxC
Whole mount in situ hybridization of CdxC and CdxB in HH stage 8 embryos (4-somite). Expression of CdxC and CdxB is limited to levels adjacent and caudal to the node. The node is indicated by the red arrowhead.
Figure 3
Figure 3. Hindbrain and Spinal Cord Progenitor Cells Acquire Rostrocaudal Regional Identity at the Early Somite Stage
(A) Schematic drawing of a stage 8 chick embryo. The boxed regions indicate neural plate explants cultured in vitro for 40 h. (B–D) Sox1 was used as a general neural marker. Bars represent mean ± s.e.m. number of cells in Hoxb4 +/ b8 /c9 , Hoxb4 +/b8 +/ c9 , and Hoxb4 +/b8 +/c9 + domains, respectively, as percentage of total cell number. Each row represents consecutive sections from a single explant. (B) Explants isolated from the RN generated Hoxb4 +/ b8 /c9 cells and few Hoxb4 +/b8 +/ c9 cells ( n = 8 explants). (C) Explants isolated at the NL generated Hoxb4 +/b8 +/ c9 cells ( n = 15 explants). (D) Explants isolated from the CN generated Hoxb4 +/b8 +/c9 + and only a few Hoxb4 +/b8 +/ c9 cells ( n = 12 explants). Scale bar represents 100 μm.
Figure 4
Figure 4. Hindbrain and Spinal Cord Progenitor Cells Generate dMNs and vMNs as Predicted by Their Respective Hox Expression Profile When Exposed to Shh-N
(A) Schematic of a stage 8 chick embryo. The boxed regions indicate isolated neural plate explants cultivated alone for 4 h and then exposed to Shh-N (15 nM) for an additional ˜50 h. (B–D) Bars represent mean ± s.e.m. number of Tbx20 +/Isl +, Hb9 +/Isl +, and Hb9 +/Hoxc9 + cells, respectively, as percentage of total cell number. Each row represents consecutive sections from a single explant. (B) Explants isolated from the RN generated Tbx20 +/Isl + cells and a few Hb9 +/Isl + cells ( n = 9 explants). (C) Explants isolated at the NL generated Hb9 +/Isl + cells, only a few Tbx20 +/Isl + cells, and no Hb9 +/Isl +/Hoxc9 + cells ( n = 12 explants). (D) Explants isolated from the CN generated Hb9 +/Isl + cells of which 80 ± 6% expressed Hoxc9 but no Tbx20 +/Isl + cells appeared ( n = 10 explants). Scale bars represent 100 μm (Isl) and 50 μm (double labels), respectively.
Figure 5
Figure 5. Cells of Spinal Cord Character Are Induced by Combinatorial Wnt and FGF Signaling at the Late Gastrula Stage
(A and B) Caudal (C) neural plate tissue explants (black box) were isolated from HH stage 4 embryos and embedded in collagen matrix where their rostrocaudal orientation was maintained during in vitro cultivation for 15 h, corresponding to a stage 8 embryo (A, D, F, H, and J) or for 44 h, corresponding to a stage 17 ˜30-somite embryo (B, E, G, I, and K). (C) Schematic drawing indicating the expression pattern of Wnt (red) and Fgf genes (green) in the primitive streak and caudal ectoderm, and in the node and primitive streak, respectively. Black dotted line indicates the presumptive neural plate. (D–K) Each row represents consecutive sections from a single explant. (D, F, H, and J) Sox2/3 was used as a presumptive neural marker. (D) Stage 4 C explants were DiI-labeled and cultured alone. Cells in the caudal domain of the explants, close to the DiI-labeled cells, expressed CdxB and CdxC ( n = 12 explants). White arrowhead indicates the DiI-labeled cells. (E, G, I, and K) Sox1 was used as a general neural marker. (E) Cells in the rostral domain of 4 C explants cultured alone expressed Krox20, whereas Hoxb4 +/b8 +/c9 + cells appeared in the caudal domain of the explants. A small domain of Hoxb4 +/b8 +/ c9 cells, but no domain of cells expressing Hoxb4 alone, were generated ( n = 30 explants). (F) Explants cultured in the presence of mFrz8CRD-IgG conditioned medium (300 μl/ml culture medium) generated Sox2/3 + neural cells but no CdxB or CdxC positive caudal neural cells ( n = 11 explants). (G) Explants cultured in the presence of mFrz8CRD-IgG conditioned medium (300 μl/ml culture medium) generated Otx2 + but no, or few, caudal neural cells ( n = 12 explants). (H) Explants cultured in the presence of SU5402 (5 μM), an inhibitor of FGF signaling, generated Sox2/3 + neural cells but no CdxB or CdxC positive caudal neural cells ( n = 8 explants). (I) Explants cultured in the presence of SU5402 (5 μM), an inhibitor of FGF signaling, generated Otx2 + but no, or few, caudal neural cells ( n = 9 explants). (J) Simultaneous exposure to Wnt3A (˜75 ng/ml) and FGF4 (60 ng/ml) resulted in the generation of cells that expressed CdxB and CdxC in the entire explant ( n = 17 explants). Scale bar represents 100 μm. (K) Exposure to Wnt3A (˜75 ng/ml) and FGF4 (60 ng/ml), in combination, almost completely blocked the generation of Krox20 + rHB cells, and only Hoxb4 +/b8 +/c9 + spinal cord cells were generated ( n = 17 explants). Scale bar represents 100 μm.
Figure 6
Figure 6. Wnt Signaling Is Required for the Generation of dMNs and vMNs in the Hindbrain and Spinal Cord
(A) Caudal (C) neural plate tissue explants (black box) were isolated from HH stage 4 embryos. Explants were cultured alone or in the presence of mFrz8CRD-IgG for 28 h and then exposed to Shh-N (15 nM) for an additional 38 h. (B–C) Bars represent mean ± s.e.m. number of Tbx20 +/Isl +, Hb9 +/Isl +, Hb9 +/Hoxc9 +, and Isl1 + cells, respectively, as percentage of total cell number. Each row represents consecutive sections from a single explant. (B) Stage 4 C explants cultured with Shh-N alone generated Tbx20 +/Isl + cells in the rostral domain of the explant and Hb9 +/Isl + cells and Hb9 +/Hoxc9 + cells in the caudal domain of the explant ( n = 18 explants). (C) Explants cultured in the presence of mFrz8CRD-IgG conditioned medium (500 μl/ml culture medium) and Shh-N generated Isl1/2 + cells but no Tbx20 +, Hb9 +, or Hoxc9 + cells ( n = 7 explants). Scale bars represent 100 μm (Isl1/2) and 50 μm (double labels), respectively.
Figure 7
Figure 7. RA Induces cHB Cells, and RA and FGF, in Combination, Induce rSC Cells
(A) Schematic drawing of a stage 4 embryo. Dotted line indicates the presumptive neural plate. Black box indicates caudal (C) neural plate explant isolated and cultured in vitro for 44 h. The red mark indicates the caudal margin of the explant labeled with DiI. Bars represent mean ± s.e.m. number of cells in Krox20 + Hoxb4 + /b8 /c9 , Hoxb4 +/b8 +/ c9 , and Hoxb4 +/b8 +/c9 + domains, respectively, as percentage of total cell number. (B–D) Each row represents consecutive sections from a single explant. (B) Control stage 4 C explants generated Krox20 + cells in the rostral, and Hoxb4 +/b8 +/ c9 + cells were generated in the caudal region of the explant, adjacent to the DiI-labeled cells. A small domain of Hoxb4 +/b8 +/ c9 cells was generated in the medial region but no domain of cells expressing Hoxb4 alone was generated ( n = 7 explants). (C) RA (10 nM) blocked the generation of Krox20 + and induced Hoxb4 +/ b8 /c9 cells in the rostral region. Adjacent to the DiI-labeled cells in the caudal region of the explant, Hoxb4 +/b8 +/ c9 cells, but no Hoxb4 +/b8 +/c9 + cells, were generated ( n = 6 explants). (D) RA (10 nM) and FGF4 (30 ng/ml), in combination, generated Hoxb4 +/b8 + /c9 cells in both the rostral and caudal regions. No, or a few, Hoxb4 +/b8 +/ c9 + cells appeared, and no Krox20 + or Hoxb4 + /b8 /c9 cells were generated ( n = 5 explants). Scale bar represents 100 μm.
Figure 8
Figure 8. Wnt and FGF, in Combination, Induce Cdx Gene Expression in Prospective FB Cells
(A) Schematic drawing of a stage 4 embryo. Dotted line indicates the presumptive neural plate. Red box indicates prospective FB explants used for in vitro studies. (B–D) Sox2 and Sox3, in combination, were used as general presumptive neural markers. Each row represents consecutive sections from a single explant. (B) Control stage 4 FB explants generated Sox2 +/3 + but no CdxC +/CdxB + presumptive neural cells ( n = 24 explants). (C) Stage 4 FB explants cultured in the presence of Wnt (˜150 ng/ml) and FGF (60 ng/ml) simultaneously generated CdxC + /CdxB + presumptive caudal neural cells ( n = 26 explants). (D) 4 FB explants cultivated in the presence of Wnt3A (˜150 ng/ml), RA (10 nM), and FGF (30 ng/ml) generated CdxC + /CdxB + presumptive caudal neural cells ( n = 18 explants). (E) 4 FB explants cultivated in the presence of Wnt3A (˜150 ng/ml) and RA (10 nM) did not generate CdxC + /CdxB + presumptive caudal neural cells ( n =14 explants).
Figure 9
Figure 9. Combinatorial Wnt, RA, and FGF Signaling Reconstruct Hox Gene Profiles Characteristic of the cHB and Spinal Cord
(A) Schematic drawing of a stage 4 chick embryo. Dotted line indicates the presumptive neural plate. Red box indicates FB explants isolated and cultured in vitro for 44 h. (B–F) Sox1 was used as a general neural marker. Bars represent mean ± s.e.m. number of cells in Otx2 +, Hoxb4 +/ b8 /c9 , Hoxb4 +/b8 +/ c9 , and Hoxb4 +/b8 +/c9 + domains, respectively, as percentage of total cell number. Each row represents consecutive sections from a single explant. (B) Control stage 4 FB explants generated Sox1 +/Otx2 + but no caudal neural cells ( n = 24 explants). (C) Stage 4 FB explants cultured in the presence of Wnt (˜150 ng/ml) and FGF (60 ng/ml) generated Hoxb4 +/b8 +/c9 + cells and only a few Krox20 + cells ( n = 24 explants). (D) Cultivation in the presence of Wnt3A (˜150 ng/ml), RA (10 nM), and FGF (30 ng/ml) generated Hoxb4 +/b8 +/ c9 cells and a few Hoxb4 +/b8 +/c9 + cells ( n = 18 explants). (E) Cultivation in the presence of Wnt3A (˜150 ng/ml) and RA (10 nM) generated Hoxb4 +/ b8 /c9 cells and no, or only a few, Hoxb4 +/b8 +/ c9 cells ( n = 28 explants). (F) Exposure to Wnt3A (˜150 ng/ml) and RA (10 nM) in the presence of SU5402 (3 μM), an inhibitor of FGF signaling, generated Hoxb4 +/ b8 /c9 cells ( n = 12 explants). Scale bar represents 100 μm.
Figure 10
Figure 10. Hox Gene Profiles Induced by Wnt, RA, and/or FGF Signals Predict Later MN Subtype
(A) Schematic drawing of a stage 4 embryo. Dotted line indicates the presumptive neural plate. Red box indicates prospective FB explants used for in vitro studies. (B–E) Explants were cultured alone or exposed to Wnt, RA, and/or FGF4 for 44 h, then washed and exposed to Shh-N (15 nM) for an additional 22 h. Bars represent mean ± s.e.m. number of Tbx20 +/Isl +, Hb9 +/Isl +, and Hb9 +/Hoxc9 + cells, respectively, as percentage of total cell number. (B–E) Each row represents consecutive sections from a single explant. (B) Stage 4 FB explants cultured alone, before exposure of Shh-N, generated Isl + cells but no Tbx20 +, Hb9 +, or Hoxc9 + cells ( n = 6 explants). (C) Stage 4 FB explants cultured in the presence of Wnt3A (˜150 ng/ml) and RA (10 nM), before exposure of Shh-N, generated Tbx20 +/Isl + cells but no, or very few, Hb9 +/Isl + cells and no Hoxc9 + cells ( n = 12 explants). (D) Cultivation in the presence of Wnt3A (˜150 ng/ml), RA (10 nM), and FGF4 (30 ng/ml), before exposure of Shh-N, generated Hb9 +/Isl + cells and only a few Tbx20 +/Isl + and Hb9 +/Hoxc9 + cells ( n = 14 explants). (E) Cultivation in the presence of Wnt3A (˜150 ng/ml) and FGF4 (60 ng/ml), before exposure of Shh-N, generated Hb9 +/Isl + and Hb9 +/Hoxc9 + cells but no Tbx20 + cells ( n = 9 explants). Scale bars represent 100 μm (Isl) and 50 μm (double labels), respectively.
Figure 11
Figure 11. Combinatorial Wnt, RA, and FGF Signals Specify Progenitor Cell Identity That Prefigure MN Subtype in the Developing Hindbrain and Spinal Cord
Combinatorial actions of Wnt, FGF, and RA signals specify neural progenitor cells expressing Hox gene profiles characteristic of the cHB, rSC, and cSC that generate patterns of differentiated MNs, with dMN or vMN exit points, characteristic of hindbrain and spinal cord, in response to Shh signaling.

Comment in

Similar articles

Cited by

References

    1. Guthrie S. Neuronal development: Putting motor neurons in their place. Curr Biol. 2004;14:R166–168. - PubMed
    1. Jessell TM. Neuronal specification in the spinal cord: Inductive signals and transcriptional codes. Nat Rev Genet. 2000;1:20–29. - PubMed
    1. Lumsden A, Krumlauf R. Patterning the vertebrate neuraxis. Science. 1996;274:1109–1115. - PubMed
    1. Briscoe J, Ericson J. The specification of neuronal identity by graded Sonic Hedgehog signaling. Semin Cell Dev Biol. 1999;10:353–362. - PubMed
    1. Helms AW, Johnson JE. Specification of dorsal spinal cord interneurons. Curr Opin Neurobiol. 2003;13:42–49. - PubMed

Publication types

MeSH terms