

Haplotype block structure is conserved across mammals
- PMID: 16895449
- PMCID: PMC1523234
- DOI: 10.1371/journal.pgen.0020121
Haplotype block structure is conserved across mammals
Abstract
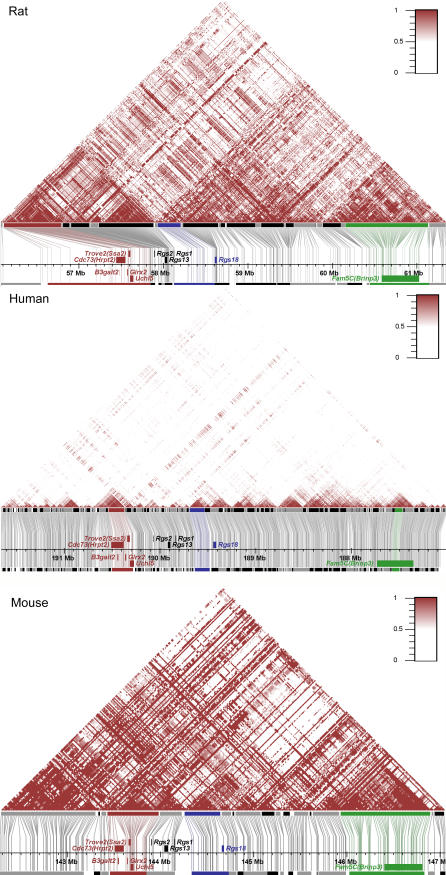
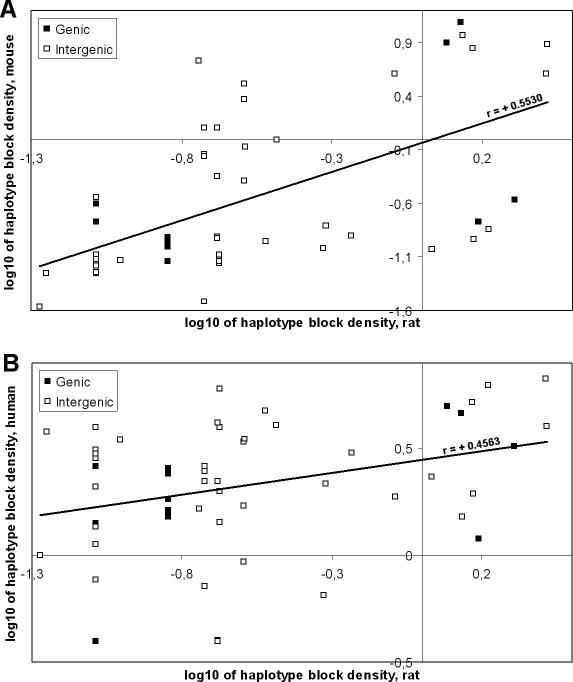
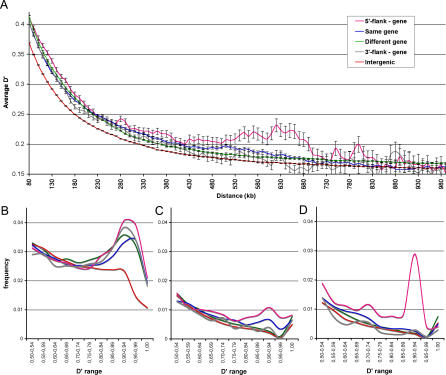
Genetic variation in genomes is organized in haplotype blocks, and species-specific block structure is defined by differential contribution of population history effects in combination with mutation and recombination events. Haplotype maps characterize the common patterns of linkage disequilibrium in populations and have important applications in the design and interpretation of genetic experiments. Although evolutionary processes are known to drive the selection of individual polymorphisms, their effect on haplotype block structure dynamics has not been shown. Here, we present a high-resolution haplotype map for a 5-megabase genomic region in the rat and compare it with the orthologous human and mouse segments. Although the size and fine structure of haplotype blocks are species dependent, there is a significant interspecies overlap in structure and a tendency for blocks to encompass complete genes. Extending these findings to the complete human genome using haplotype map phase I data reveals that linkage disequilibrium values are significantly higher for equally spaced positions in genic regions, including promoters, as compared to intergenic regions, indicating that a selective mechanism exists to maintain combinations of alleles within potentially interacting coding and regulatory regions. Although this characteristic may complicate the identification of causal polymorphisms underlying phenotypic traits, conservation of haplotype structure may be employed for the identification and characterization of functionally important genomic regions.
Conflict of interest statement
Competing interests. The authors have declared that no competing interests exist.
Figures
Similar articles
-
Genomic haplotype blocks may not accurately reflect spatial variation in historic recombination intensity.Mol Biol Evol. 2005 Mar;22(3):735-40. doi: 10.1093/molbev/msi058. Epub 2004 Nov 24. Mol Biol Evol. 2005. PMID: 15563716
-
Haplotype-specific linkage disequilibrium patterns define the genetic topography of the human MHC.Hum Mol Genet. 2003 Mar 15;12(6):647-56. Hum Mol Genet. 2003. PMID: 12620970
-
Recombination hotspots and block structure of linkage disequilibrium in the human genome exemplified by detailed analysis of PGM1 on 1p31.Hum Mol Genet. 2004 Dec 15;13(24):3089-102. doi: 10.1093/hmg/ddh337. Epub 2004 Oct 27. Hum Mol Genet. 2004. PMID: 15509594
-
Using haplotype blocks to map human complex trait loci.Trends Genet. 2003 Mar;19(3):135-40. doi: 10.1016/S0168-9525(03)00022-2. Trends Genet. 2003. PMID: 12615007 Review.
-
On the applicability of a haplotype map to un-assayed populations.Hum Genet. 2004 Jan;114(2):214-7. doi: 10.1007/s00439-003-1046-x. Epub 2003 Oct 25. Hum Genet. 2004. PMID: 14579151 Review.
Cited by
-
Association between Fbxl5 gene polymorphisms and partial economic traits in Jinghai Yellow chickens.Arch Anim Breed. 2019 Mar 20;62(1):91-97. doi: 10.5194/aab-62-91-2019. eCollection 2019. Arch Anim Breed. 2019. PMID: 31807618 Free PMC article.
-
Mapping Recombination Rate on the Autosomal Chromosomes Based on the Persistency of Linkage Disequilibrium Phase Among Autochthonous Beef Cattle Populations in Spain.Front Genet. 2019 Nov 20;10:1170. doi: 10.3389/fgene.2019.01170. eCollection 2019. Front Genet. 2019. PMID: 31824571 Free PMC article.
-
Association Analysis of Single Nucleotide Polymorphisms in the 5' Regulatory Region of the IL-6 Gene with Eimeria tenella Resistance in Jinghai Yellow Chickens.Genes (Basel). 2019 Nov 5;10(11):890. doi: 10.3390/genes10110890. Genes (Basel). 2019. PMID: 31694169 Free PMC article.
-
Linkage disequilibrium--understanding the evolutionary past and mapping the medical future.Nat Rev Genet. 2008 Jun;9(6):477-85. doi: 10.1038/nrg2361. Nat Rev Genet. 2008. PMID: 18427557 Free PMC article. Review.
-
Genome-wide compatible SNP intervals and their properties.ACM Int Conf Bioinform Comput Biol (2010). 2010 Aug;2010:43-52. doi: 10.1145/1854776.1854788. ACM Int Conf Bioinform Comput Biol (2010). 2010. PMID: 29152612 Free PMC article.
References
-
- Yalcin B, Willis-Owen SA, Fullerton J, Meesaq A, Deacon RM, et al. Genetic dissection of a behavioral quantitative trait locus shows that Rgs2 modulates anxiety in mice. Nat Genet. 2004;36:1197–1202. - PubMed
-
- Cuppen E. Haplotype-based genetics in mice and rats. Trends Genet. 2005;21:318–322. - PubMed
-
- Wade CM, Daly MJ. Genetic variation in laboratory mice. Nat Genet. 2005;37:1175–1180. - PubMed
-
- Wade CM, Kulbokas EJ, III, Kirby AW, Zody MC, Mullikin JC, et al. The mosaic structure of variation in the laboratory mouse genome. Nature. 2002;420:574–578. - PubMed
Publication types
MeSH terms
LinkOut - more resources
Full Text Sources
