Comparative Study
. 2006 Aug 8:7:199.
doi: 10.1186/1471-2164-7-199.

Integration of hybridization-based markers (overgos) into physical maps for comparative and evolutionary explorations in the genus Oryza and in Sorghum

Affiliations
Comparative Study

Integration of hybridization-based markers (overgos) into physical maps for comparative and evolutionary explorations in the genus Oryza and in Sorghum

Barbara L Hass-Jacobus et al. BMC Genomics. .

Abstract

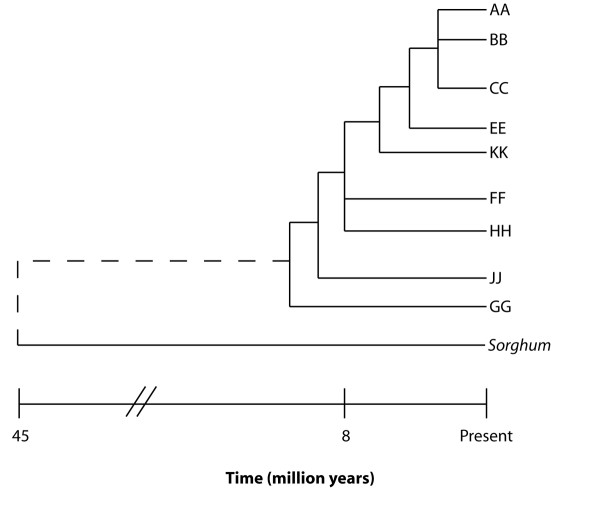
Background: With the completion of the genome sequence for rice (Oryza sativa L.), the focus of rice genomics research has shifted to the comparison of the rice genome with genomes of other species for gene cloning, breeding, and evolutionary studies. The genus Oryza includes 23 species that shared a common ancestor 8-10 million years ago making this an ideal model for investigations into the processes underlying domestication, as many of the Oryza species are still undergoing domestication. This study integrates high-throughput, hybridization-based markers with BAC end sequence and fingerprint data to construct physical maps of rice chromosome 1 orthologues in two wild Oryza species. Similar studies were undertaken in Sorghum bicolor, a species which diverged from cultivated rice 40-50 million years ago.

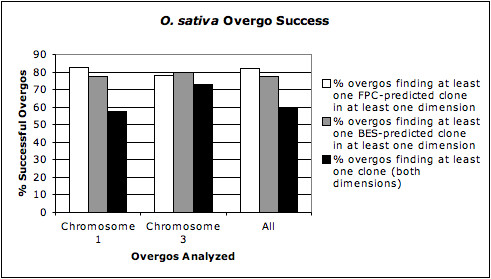
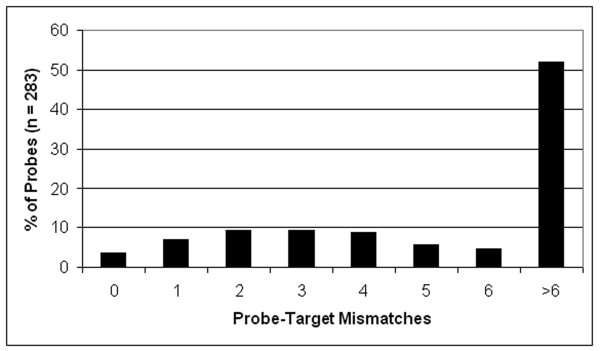
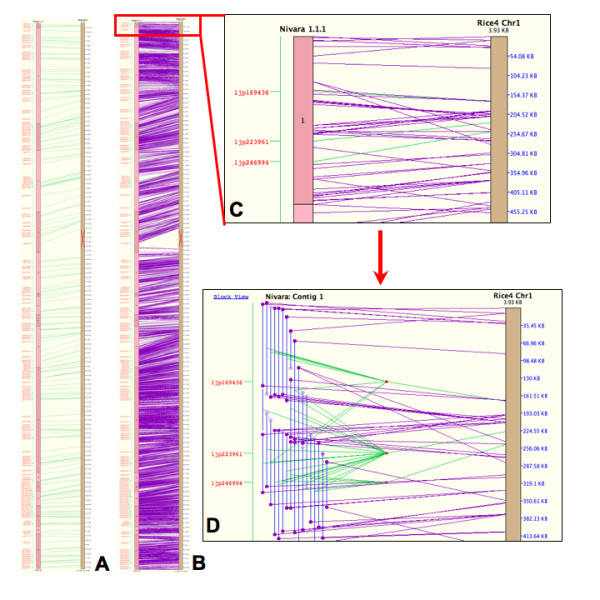
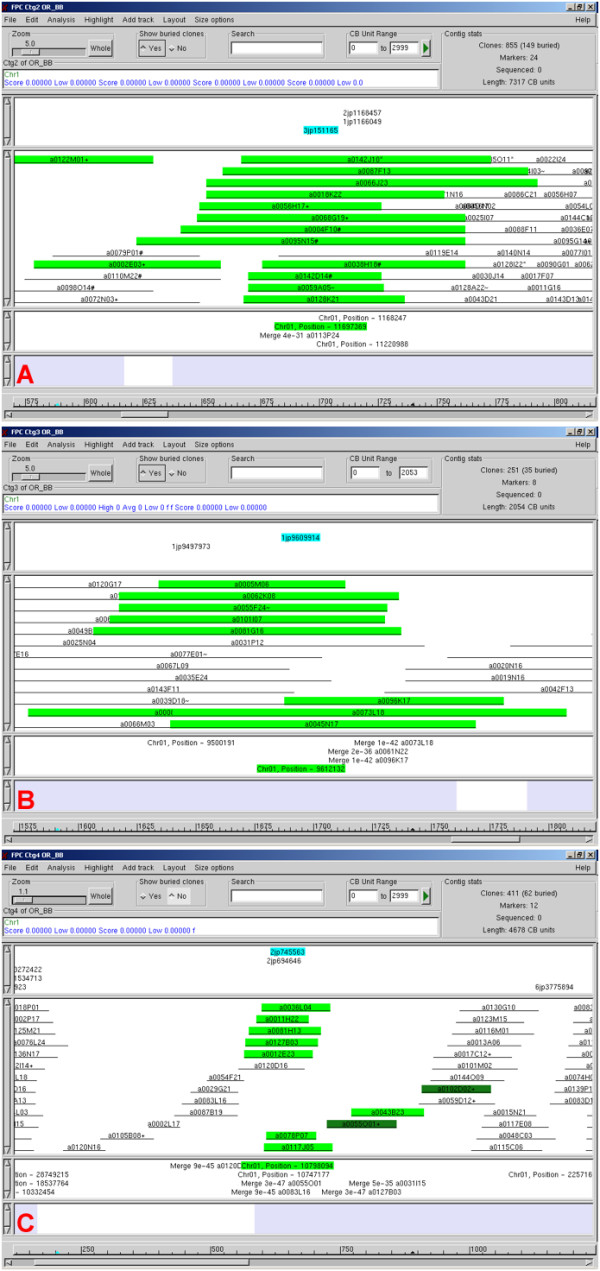
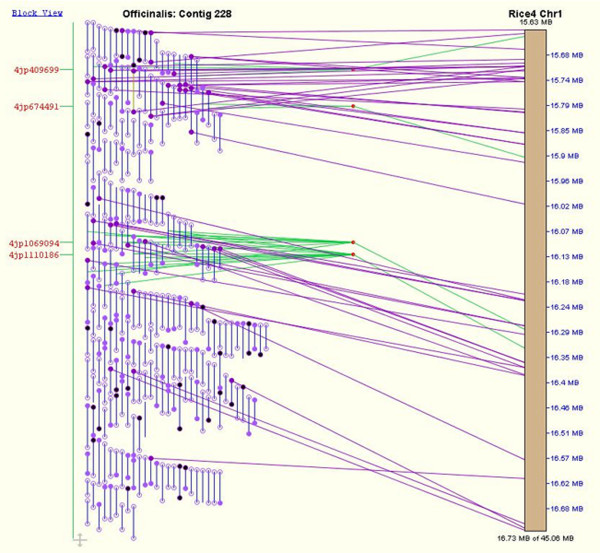
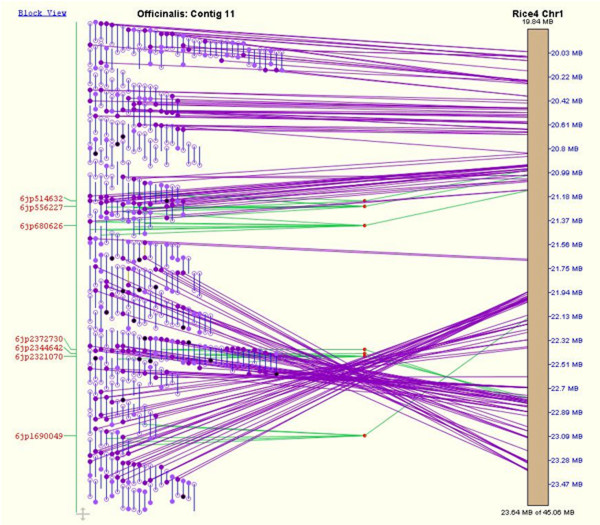
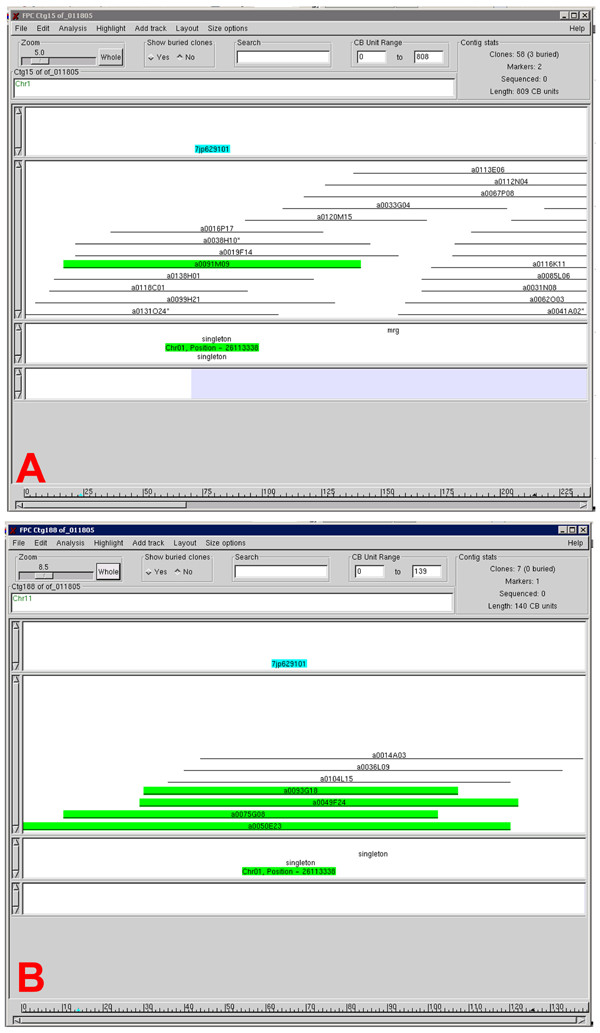
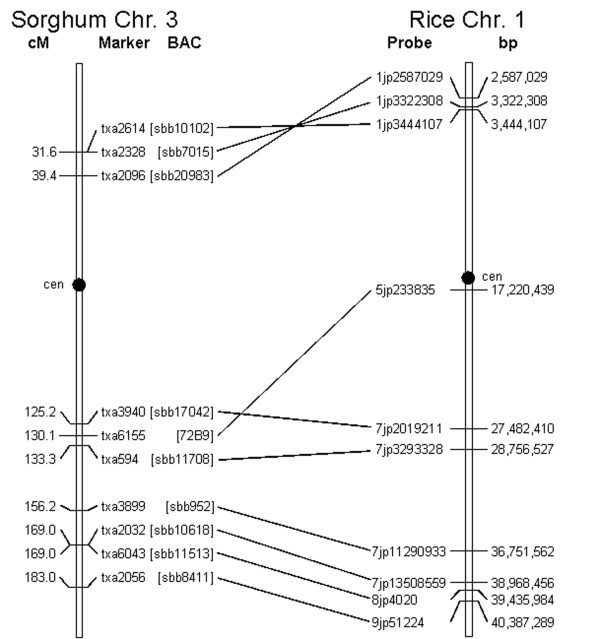
Results: Overgo markers, in conjunction with fingerprint and BAC end sequence data, were used to build sequence-ready BAC contigs for two wild Oryza species. The markers drove contig merges to construct physical maps syntenic to rice chromosome 1 in the wild species and provided evidence for at least one rearrangement on chromosome 1 of the O. sativa versus Oryza officinalis comparative map. When rice overgos were aligned to available S. bicolor sequence, 29% of the overgos aligned with three or fewer mismatches; of these, 41% gave positive hybridization signals. Overgo hybridization patterns supported colinearity of loci in regions of sorghum chromosome 3 and rice chromosome 1 and suggested that a possible genomic inversion occurred in this syntenic region in one of the two genomes after the divergence of S. bicolor and O. sativa.

Conclusion: The results of this study emphasize the importance of identifying conserved sequences in the reference sequence when designing overgo probes in order for those probes to hybridize successfully in distantly related species. As interspecific markers, overgos can be used successfully to construct physical maps in species which diverged less than 8 million years ago, and can be used in a more limited fashion to examine colinearity among species which diverged as much as 40 million years ago. Additionally, overgos are able to provide evidence of genomic rearrangements in comparative physical mapping studies.


Figures

Figure 1
Figure 1
Phylogeny of Oryza and Sorghum. Simplified phylogeny showing the estimated divergence times of Sorghum and Oryza species. Oryza lineages are summarized by genome type, designated AA through JJ according to morphological, physiological, biochemical, and molecular differences, including chromosome pairing behavior of F1 hybrids from interspecific crosses [45]. This diagram is based on the data of Gaut et al. (2002) [13] and Ge et al. (1999) [11].
Figure 2
Figure 2
O. sativa overgo success. Percentage of overgos estimated to have been successful in one dimension, based on FPC and BES maps, and the percentage of overgos that were successful in both dimensions. All overgos were designed from the O. sativa sequence and hybridized in 12-overgo pools to an O. sativa BAC library.
Figure 3
Figure 3
Distribution of mismatches between rice overgos and Sorghum sequence. The percentage of 36 bp overgo probes having 0 to >6 mismatches to available Sorghum sequence is shown. Sorghum sequences corresponding to regions of rice from which overgo probes were designed were identified using BLAT alignment data available from the Gramene (version 19) database [33]. Overgo sequences were aligned to Sorghum sequence by BLASTN using an open-gap cost of two and a gap-extension cost of one, with low-complexity filtration turned off.
Figure 4
Figure 4
Comparative physical map of O. nivara with rice chromosome 1. SyMap screenshots showing the completed physical map of O. nivara chromosome 1 aligned to the O. sativa chromosome 1 pseudomolecule. (A) Whole-chromosome view of the O. nivara pseudomolecule aligned to the O. sativa chromosome 1 pseudomolecule, showing overgo marker alignments only. (B) Whole-chromosome view of the O. nivara pseudomolecule aligned to the O. sativa chromosome 1 pseudomolecule, showing both overgo marker and BAC end sequence (BES) alignments. (C) Zoomed-in view of the overgo and BES alignments between O. nivara contig 1 and the O. sativa chromosome 1 pseudomolecule. (D) More detailed view of (C) showing the actual clones comprising O. nivara contig 1 and their BESs. In this view, the alignments of individual BES can be seen, as well as individual clones that were detected by overgo markers, and the alignments of those markers to the O. sativa chromosome 1 pseudomolecule. In (A-C), BAC contigs are represented by numbered blocks which are stacked vertically to form the O. nivara pseudomolecule shown on the left of each alignment, while the O. sativa pseudomolecule is shown in brown on the right of each alignment. The red 'X' on the O. sativa pseudomolecule represents the centromere. Overgo marker names are listed in red text to the left of each alignment, while coordinates along the O. sativa pseudomolecule are listed in blue text to the right of each alignment. Green lines stretching from the O. nivara pseudomolecule to the O. sativa pseudomolecule in each alignment show where clones from the O. nivara contig align to the O. sativa chromosome, while purple lines show where O. nivara clones' BESs align to the O. sativa pseudomolecule. In (D), blue vertical lines on the left half of the figure represent O. nivara BAC clones. Circles on the ends of the clones represent BESs. Open circles are BESs that did not match sequences from O. sativa, while closed circles are BESs that matched O. sativa sequences. Purple lines stretching from a BES on the left to the pseudomolecule on the right show where the BES to which the line is attached aligns to the pseudomolecule. In the case of overgo markers, a marker will often hit more than one BAC clone. Green lines stretch from the middle of all clones hit by that marker to a red "marker join dot." The green line stretching from the marker join dot to the pseudomolecule shows where the marker sequence is located on the pseudomolecule, thereby showing where the O. nivara clones hit by the marker align to the O. sativa pseudomolecule.
Figure 5
Figure 5
Contig merges driven by overgos in O. nivara . Panels A-C display three examples from FPC of contig merges driven by overgo hybridizations. Overgo names are highlighted in blue, while BAC clones to which those overgos hybridized are highlighted in green.
Figure 6
Figure 6
Alignment of O. officinalis contig to rice chromosome 1. A detailed view of the alignment of an O. officinalis BAC contig to the O. sativa chromosome 1 pseudomolecule using BAC end sequences (BES) and overgo markers. The hybridizations of overgos 4jp1069094 and 4jp1110186 in particular to O. officinalis BAC clones drove the merger of two initially separated contigs to form the O. officinalis contig shown here. The brown bar on the right side of the figure represents a portion of the O. sativa chromosome 1 pseudomolecule, and the coordinates along the pseudomolecule are listed in blue on the righthand side of the pseudomolecule. Blue vertical lines on the left half of the figure represent O. officinalis BAC clones. Circles on the ends of the clones represent BESs. Open circles are BESs that did not match sequences from O. sativa, while closed circles are BESs that matched O. sativa sequences. Purple lines stretching from a BES on the left to the pseudomolecule on the right show where the BES to which the line is attached aligns to the pseudomolecule. Red text on the left side of the figure shows the names of overgo markers with hits to clones in the O. officinalis BAC contig shown. In the case of overgo markers, a marker will often hit more than one BAC clone. Green lines stretch from the middle of all clones hit by that marker to a red "marker join dot." The green line stretching from the marker join dot to the pseudomolecule shows where the marker sequence is located on the pseudomolecule, thereby showing where the O. officinalis clones hit by the marker align to the O. sativa pseudomolecule.
Figure 7
Figure 7
Alignment of O. officinalis contig to region of rice chromosome 1 showing putative inversion. Alignment of an O. officinalis contig to rice chromosome 1. Overgos confirm the placement of clones in the contig such that a putative genomic inversion of the region stretching from approximately 21.94 MB to 23.40 MB on the rice pseudomolecule is apparent. The brown bar on the right side of the figure represents a portion of the O. sativa chromosome 1 pseudomolecule, and the coordinates along the pseudomolecule are listed in blue on the righthand side of the pseudomolecule. Blue vertical lines on the left half of the figure represent O. officinalis BAC clones. Circles on the ends of the clones represent BAC end sequences (BES). Open circles are BESs that did not match sequences from O. sativa, while closed circles are BESs that matched O. sativa sequences. Purple lines stretching from a BES on the left to the pseudomolecule on the right show where the BES to which the line is attached aligns to the pseudomolecule. Red text on the left side of the figure shows the names of overgo markers with hits to clones in the O. officinalis BAC contig shown. In the case of overgo markers, a marker will often hit more than one BAC clone. Green lines stretch from the middle of all clones hit by that marker to a red "marker join dot." The green line stretching from the marker join dot to the pseudomolecule shows where the marker sequence is located on the pseudomolecule, thereby showing where the O. officinalis clones hit by the marker align to the O. sativa pseudomolecule.
Figure 8
Figure 8
Merger of two O. officinalis contigs by a single overgo probe. FPC views of contigs 15 (A) and 188 (B) of O. officinalis. These two contigs were merged in the physical map based on the hybridization of overgo 7jp629101 to both contigs, leading to an additional merger with contig 16 (not shown).
Figure 9
Figure 9
Comparative map between Sorghum chromosome 3 and rice chromosome 1. Hybridization of overgo probes detected the indicated BAC clones, which were previously anchored to the Sorghum genetic map using a variety of molecular markers [16, 17]. The rice physical map is based on the TIGR Release 3 pseudochromosome assembly [39]. The data show a previously identified inversion event affecting the short arms of the chromosomes. Probe 5jp233835 identified a locus that has possibly moved in one lineage relative to the other.

References

    1. Dawe DC. Essential food for the poor. Rice Today. 2002;1:29.
    1. Goff SA, Ricke D, Lan T-H, Presting G, Wang R, Dunn M, Glazebrook J, Sessions A, Oeller P, Varma H, Hadley D, Hutchison D, Martin C, Katagiri F, Lange BM, Moughamer T, Xia Y, Budworth P, Zhong J, Miguel T, Paszkowski U, Zhang S, Colbert M, Sun W-L, Chen L, Cooper B, Park S, Wood TC, Mao L, Quail P, Wing R, Dean R, Yu Y, Zharkikh A, Shen R, Sahasrabudhe S, Thomas A, Cannings R, Gutin A, Pruss D, Reid J, Tavtigian S, Mitchell J, Eldredge G, Scholl T, Miller RM, Bhatnagar S, Adey N, Rubano T, Tusneem N, Robinson R, Feldhaus J, Macalma T, Olphant A, Briggs S. A draft sequence of the rice genome (Oryza sativa L. ssp. japonica) Science. 2002;296:92–100. doi: 10.1126/science.1068275. - DOI - PubMed
    1. Yu J, Hu S, Wang J, Wong GK-S, Li S, Liu B, Deng Y, Dai L, Zhou Y, Zhang X, Cao M, Liu J, Sun J, Tang J, Chen Y, Huang X, Lin W, Ye C, Tong W, Cong L, Geng J, Han Y, Li L, Wei L, Li J, Liu Z, Li L, Liu J, Qi Q, Liu J, Li L, Li T, Wang X, Lu H, Wu T, Zhu M, Ni P, Han H, Dong W, Ren X, Feng X, Cui P, Li X, Wang H, Xu X, Zhai W, Xu Z, Zhang J, He S, Zhang J, Xu J, Zhang K, Zheng X, Dong J, Zeng W, Tao L, Ye J, Tan J, Ren X, Chen X, He J, Liu D, Tian W, Tian C, Xia H, Bao Q, Li G, Gao H, Cao T, Wang J, Zhao W, Li P, Chen W, Wang X, Zhang Y, Hu J, Wang J, Liu S, Yang J, Zhang G, Xiong Y, Li Z, Mao L, Zhou C, Zhu Z, Chen R, Hao B, Zheng W, Chen S, Guo W, Li G, Liu S, Tao M, Wang J, Zhu L, Yuan L, Yang H. A draft sequence of the rice genome (Oryza sativa L. ssp. japonica) Science. 2002;296:79–92. doi: 10.1126/science.1068037. - DOI - PubMed
    1. Chen M, Presting GG, Barbazuk WB, Goicoechea JL, Blackmon B, Fang G, Kim H-R, Frisch D, Yu Y, Sun S, Higingbottom S, Phimphilai J, Phimphilai D, Thurmond S, Gaudette B, Li P, Liu J, Hatfield J, Main D, Farrar K, Henderson C, Barnett L, Costa R, Williams B, Walser S, Atkins M, Hall C, Baduman MA, Tomkins JP, Luo M, Bancroft I, Salse J, Regad F, Mohapatra T, Singh NK, Tyagi AK, Soderlund C, Dean RA, Wing RA. An integrated physical and genetic map of the rice genome. The Plant Cell. 2002;14:537–545. doi: 10.1105/tpc.010485. - DOI - PMC - PubMed
    1. Paterson AH, Bowers JE, Peterson DG, Estill JC, Chapman BA. Structure and evolution of cereal genomes. Current Opinion in Genetics & Development. 2003;13:644–650. doi: 10.1016/j.gde.2003.10.002. - DOI - PubMed

Publication types