. 2006 Aug;5(8):1194-205.
doi: 10.1128/EC.00096-06.

Characterization and developmentally regulated localization of the mitochondrial carrier protein homologue MCP6 from Trypanosoma brucei

Affiliations

Characterization and developmentally regulated localization of the mitochondrial carrier protein homologue MCP6 from Trypanosoma brucei

Claudia Colasante et al. Eukaryot Cell. 2006 Aug.

Abstract

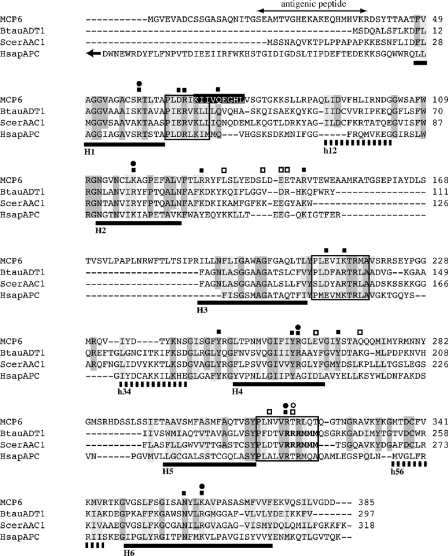
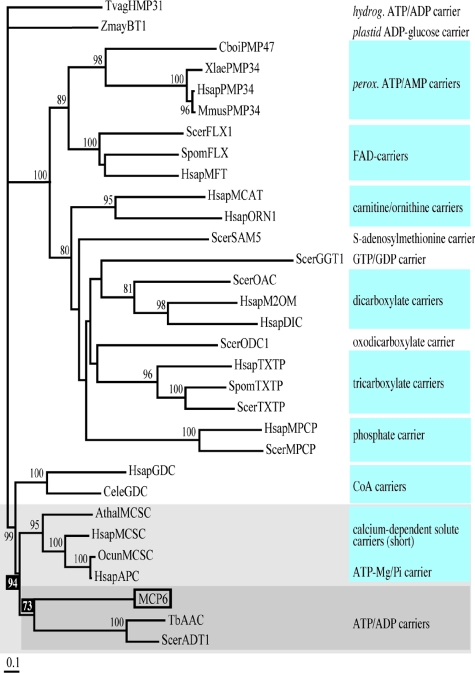
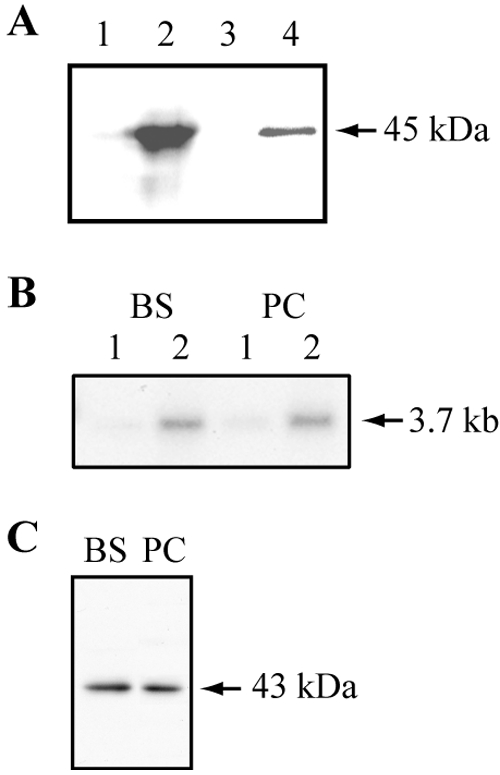
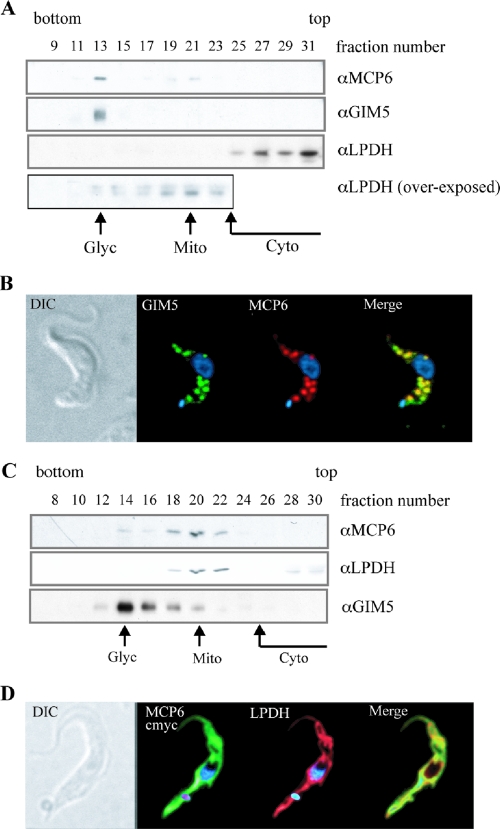
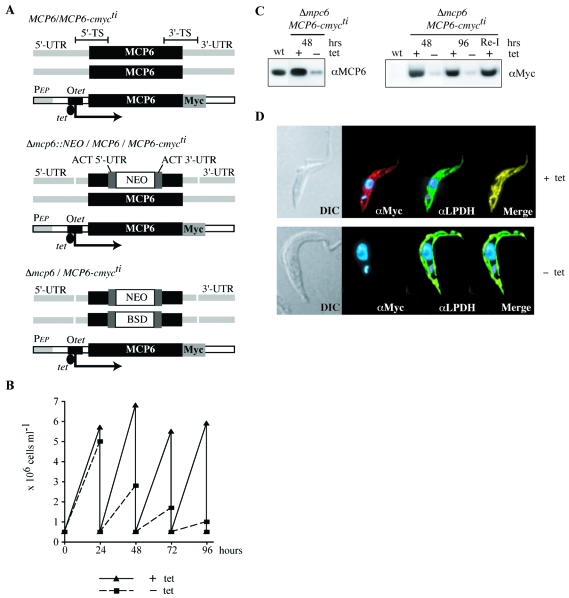
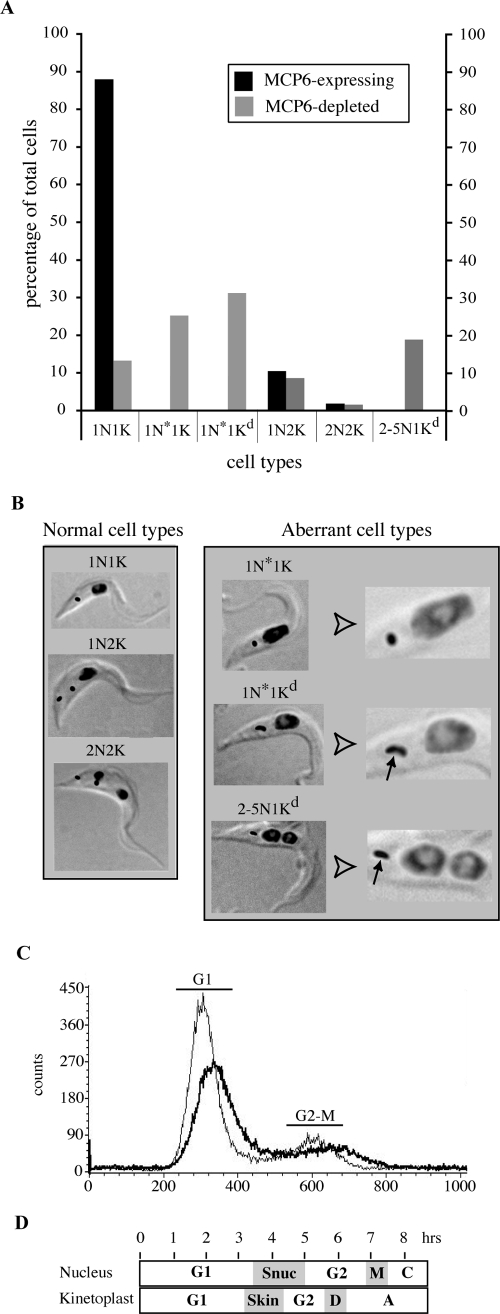
Proteins of the mitochondrial carrier family (MCF) are located mainly in the inner mitochondrial membrane and mediate the transport of a large range of metabolic intermediates. The genome of Trypanosoma brucei harbors 29 genes encoding different MCF proteins. We describe here the characterization of MCP6, a novel T. brucei MCF protein. Sequence comparison and phylogenetic reconstruction revealed that MCP6 is closely related to different mitochondrial ADP/ATP and calcium-dependent solute carriers, including the ATP-Mg/Pi carrier of Homo sapiens. However, MCP6 lacks essential amino acids and sequence motifs conserved in these metabolite transporters, and functional reconstitution and transport assays with E. coli suggested that this protein indeed does not function as an ADP/ATP or ATP-Mg/Pi carrier. The subcellular localization of MCP6 is developmentally regulated: in bloodstream-form trypanosomes, the protein is predominantly glycosomal, whereas in the procyclic form, it is found mainly in the mitochondria. Depletion of MCP6 in procyclic trypanosomes resulted in growth inhibition, an increased cell size, aberrant numbers of nuclei and kinetoplasts, and abnormal kinetoplast morphology, suggesting that depletion of MCP6 inhibits division of the kinetoplast.


Figures

FIG. 1.
FIG. 1.
Sequence alignment of MCP6 and different mitochondrial ATP/ADP and ATP-Mg/Pi carriers. Amino acid sequences were aligned using Clustal X (30) and SE-AL. The sequences used are MCP6 (this paper), BtauADT1, mitochondrial ATP/ADP carrier ADT1 of B. taurus, ScerAAC1, mitochondrial ATP/ADP carrier AAC1 of S. cerevisiae, and HsapAPC, mitochondrial ATP-Mg/Pi carrier of H. sapiens. For database accession numbers, see Materials and Methods. Putative trans-membrane α-helices, predicted by the TMHMM (CBS, Denmark) and TMpred (EMBnet-CH) programs available at http://www.expasy.ch, are underlined by solid black bars (numbered H1 through H6), whereas the short hydrophobic stretches between the trans-membrane α-helices are marked by dashed bars (numbered h12, h34, and h56). The putative mitochondrial carrier sequence signatures are boxed. The conserved mitochondrial ATP/ADP sequence motif RRRMMM is printed in boldface. Identical or similar amino acids, using MCP6 as the lead sequence, are shaded dark gray or light gray, respectively. Gaps are indicated by dashes. A double-headed arrow marks the peptide sequence used for immunization. A putative peroxisomal “PTS2” targeting signal is printed white on a black background but is at the wrong place in the sequence to function. The arrow at the start of the HsapAPC (21) sequence represents the N-terminal EF-hand calcium-binding domain, which is not shown in this alignment. Circles and squares mark functionally important amino acid residues identified in S. cerevisiae AAC1 (36, 53) and B. taurus ADT1 (62), respectively; when filled, they represent amino acid residues also conserved in MCP6, whereas open symbols stand for residues not conserved in MCP6.
FIG. 2.
FIG. 2.
Phylogenetic reconstruction of MCP6. MCP6 clusters within a group (shaded light gray) of MCF protein sequences encompassing the mitochondrial ATP/ADP carriers (shaded dark gray) and MCSC, including the H. sapiens APC. The bootstrap values indicated at the nodes are expressed as percentages and are calculated after resampling analysis generating 1,000 reiterated data sets. Only significant bootstrap values, equal to or higher than 60%, are shown. The different groups of functionally related sequences, each supported by significant bootstrap values, are shaded blue. For database accession numbers of the sequences, see Materials and Methods. Abbreviations: hydrog, hydrogenosomal; perox, peroxisomal.
FIG. 3.
FIG. 3.
Expression of MCP6 in E. coli (A) and T. brucei (B and C). (A) Autoradiography after heterologous expression and membrane purification of [35S]methionine-labeled His-tagged MCP6 protein. E. coli cells harboring the MCP6 expression plasmid were IPTG induced (or noninduced for the control) for protein synthesis in the presence of [35S]methionine. Details of induction, purification, and autoradiography are given in Materials and Methods. Lane 1 (not induced, control) and lane 2 (induced) each contain 30 μg of total E. coli protein after heterologous expression; lane 3 (not induced, control) and lane 4 (induced) each contain 1 μg of purified E. coli membrane protein. (B) Northern blot analysis of RNA from bloodstream (BS)- and procyclic (PC)-form trypanosomes. Twenty micrograms of total RNA (lanes 1) and 4 μg of poly(A)+ RNA (lanes 2) were hybridized with [α32P]dCTP-labeled MCP6 DNA. (C) Western blotting analysis of bloodstream (BS) and procyclic (PC) trypanosomes, using the affinity-purified αMCP6 antibody (diluted 1:1,000) and 2 × 10⁶ trypanosomes each.
FIG. 4.
FIG. 4.
Subcellular localization of MCP6 in bloodstream- and procyclic-form T. brucei cells. (A and C) Western blotting of sucrose gradient fractions obtained for bloodstream (A) and procyclic (C) trypanosomes. The bottom (densest) and top (lightest) fractions of the sucrose gradient are indicated. For both forms, MCP6 was detected using the affinity-purified αMCP6 antibody discussed in this paper. Mitochondrion-containing fractions (Mito indicates the mitochondrial peak fraction) were identified by using αLPDH (70), and the glycosome-containing fractions (Glyc indicates the glycosomal peak fraction) were identified by using αGIM5 (41). Cytosolic (Cyto) proteins were usually found in fractions 25 to 31. (B and D) Immunofluorescence microscopy of bloodstream (B) and procyclic (D) trypanosomes. For the bloodstream form (B), MCP6 was detected using the affinity-purified αMCP6 antibody discussed in this paper. For the procyclic T. brucei cell line MCP6/MCP6-cmycti (D), the myc-tagged version of MCP6 was detected by using a commercial αMyc antibody (Sigma-Aldrich) after 48 h of induction with tetracycline. Mitochondria were stained with αLPDH (70), whereas glycosomes were stained with αGIM5 (41). DAPI staining of nucleus and kinetoplast DNA is shown in blue.
FIG. 5.
FIG. 5.
Depletion (conditional double knockout) of MCP6 in procyclic-form trypanosomes. (A) Schematic representation of the strategy used for the construction of the procyclic conditional double-knockout cell line Δmcp6/MCP6-cmycti. Abbreviations: NEO, neomycin resistance cassette; BSD, blasticidin resistance cassette; ACT, actin; Otet, tet operator; PEP, procycline promoter; Myc, myc tag; TS, target sequence. (B) Growth curves of MCP6-expressing and MCP6-depleted procyclic trypanosomes. The procyclic conditional double-knockout cell line Δmcp6/MCP6-cmycti was grown for 96 h in medium with (triangles, solid line) or without (squares, dashed line) tetracycline. Every 24 h, samples were taken for the determination of cell density (cells ml−1), and grown cultures were diluted down to 5 × 10⁵ cells/ml with fresh medium. (C) Western blot analysis of Δmcp6/MCP6-cmycti cells grown with (+) or without (−) tetracycline. Samples for Western blotting were taken at 48 and 96 h. (Lane Re-I) First, Δmcp6/MCP6-cmycti cells were grown for 96 h without tetracycline, after which tetracycline was added. After reinduction (Re-I) for 24 h, cells were harvested for Western blot analysis. Wild-type cells were used as a control. (D) Immunofluorescence microscopy of procyclic Δmcp6/MCP6-cmycti trypanosomes grown with (+tet) or without (−tet) tetracycline for 96 h. The antisera used were αMyc for the staining (red) of MCP6-cmyc and αLPDH for the staining (green) of mitochondrial dihydroxylipoamide dehydrogenase. DAPI staining of nucleus and kinetoplast DNA is shown in blue.
FIG. 6.
FIG. 6.
Immunofluorescence microscopy and FACS analysis of MCP6-depleted procyclic Δmcp6/MCP6-cmycti trypanosomes. (A) Tabulation of the different cell types found for MCP6-expressing and MCP6-depleted procyclic Δmcp6/MCP6-cmycti trypanosomes. Two hundred MCP6-expressing (with tet, 96 h) and 200 MCP6-depleted (without tet, 96 h) cells were stained with DAPI and examined for the sizes and numbers of nuclei and kinetoplasts in individual cells. Abbreviations: N, normal nucleus; N*, enlarged nucleus; K, kinetoplast; Kd, dumbbell-shaped kinetoplast. (B) Phase/DAPI photographs of the different normal (left) and aberrant (right) cell types found. DAPI staining of nuclear and kinetoplast DNA is shown in black. Arrows point to dumbbell-shaped kinetoplasts. (Right panel) On the right side of this panel, magnifications are shown of the phase/DAPI photographs from the left for a better view of aberrant nuclei and kinetoplasts. (C) FACS analysis of the DNA content of procyclic-form Δmcp6/MCP6-cmycti trypanosomes. MCP6-expressing (with tet, 96 h, thin line) and MCP6-depleted (without tet, 96 h, thick line) Δmcp6/MCP6-cmycti trypanosomes were stained with propidium iodide and analyzed (50,000 cells each) with a FACScan flow cytometer for their DNA content. The x axis shows the channel number, which is proportional to the fluorescence signal and indicates DNA content. The y axis shows the number of events (counts) in each channel, which is proportional to cell numbers. G1, wild-type cells in the G1 cell cycle phase with a 2N (normal diploid) DNA content; G2-M, wild-type cells after DNA replication in the G2-M cell cycle phase. (D) Schematic representation of the T. brucei cell cycle, illustrating the temporally coordinated kinetoplast and nuclear phases. Abbreviations: Sn, nuclear S phase; M, mitosis; C, cytokinesis; Sk, kinetoplast S phase; D, kinetoplast division; A, kinetoplast segregation.

References

    1. Alibu, V. P., L. Storm, S. Haile, C. Clayton, and D. Horn. 2005. A doubly inducible system for RNA interference and rapid RNAi plasmid construction in Trypanosoma brucei. Mol. Biochem. Parasitol. 139:75-82. - PubMed
    1. Amery, L., M. Fransen, K. De Nys, G. P. Mannaerts, and P. P. Van Veldhoven. 2000. Mitochondrial and peroxisomal targeting of 2-methylacyl-CoA racemase in humans. J. Lipid Res. 41:1752-1759. - PubMed
    1. Aquila, H., T. A. Link, and M. Klingenberg. 1987. Solute carriers involved in energy transfer of mitochondria form a homologous protein family. FEBS Lett. 212:1-9. - PubMed
    1. Baerends, R. J., K. N. Faber, J. A. Kiel, I. J. van der Klei, W. Harder, and M. Veenhuis. 2000. Sorting and function of peroxisomal membrane proteins. FEMS Microbiol. Rev. 24:291-301. - PubMed
    1. Bakker, B. M., F. I. C. Mensonides, B. Teusink, P. van Hoek, P. A. M. Michels, and H. V. Westerhoff. 2000. Compartmentation protects trypanosomes from the dangerous design of glycolysis. Proc. Natl. Acad. Sci. USA 97:2087-2092. - PMC - PubMed

Publication types

MeSH terms