

Programmed transcription of the var gene family, but not of stevor, in Plasmodium falciparum gametocytes
- PMID: 16896206
- PMCID: PMC1539138
- DOI: 10.1128/EC.00029-06
Programmed transcription of the var gene family, but not of stevor, in Plasmodium falciparum gametocytes
Abstract
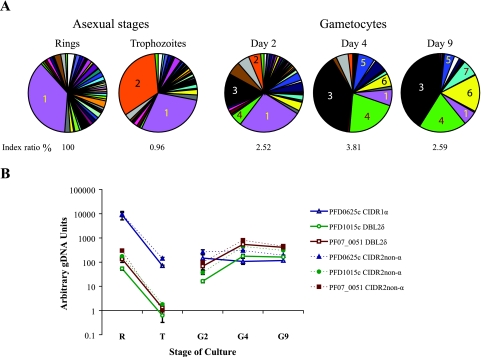
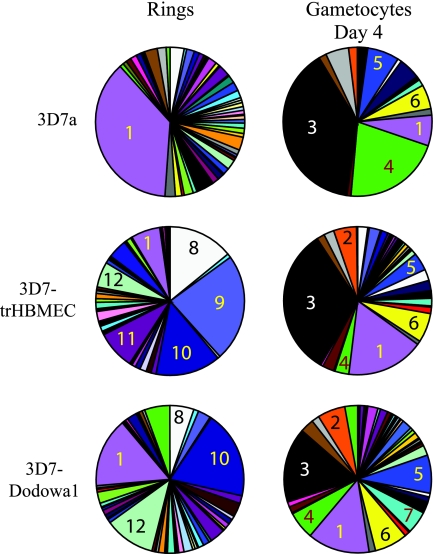
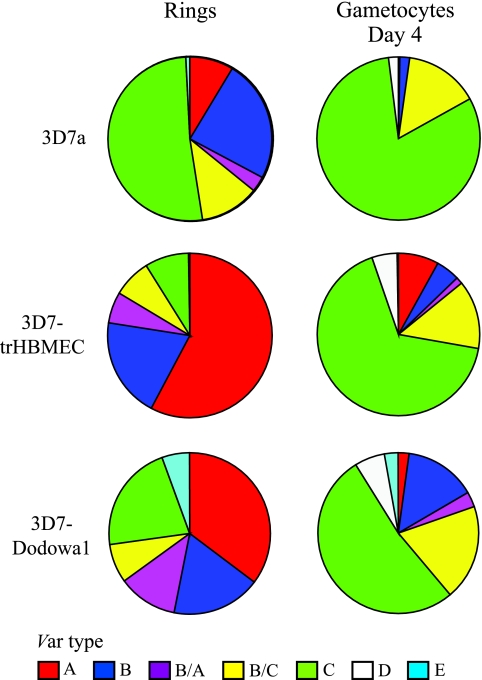
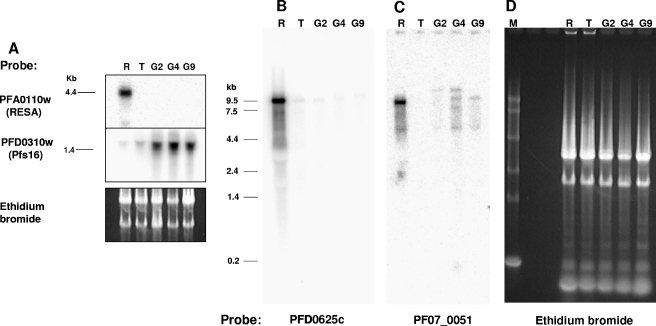
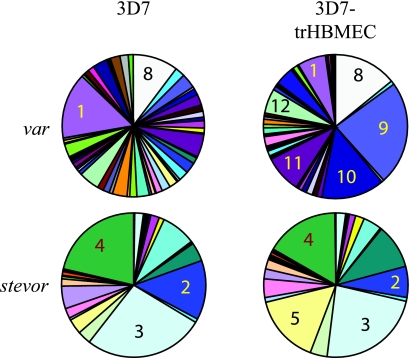
The var genes encode Plasmodium falciparum erythrocyte membrane protein 1 (PfEMP1) proteins, a set of highly diverse surface-expressed proteins that mediate adhesion of erythrocytes infected with asexual blood-stage parasites to host endothelium. Switching among expressed PfEMP1 variants in the course of a blood-stage infection is a key component of antigenic variation, and thus immune evasion, by the parasite. The majority of var loci are found in the subtelomeric regions of P. falciparum chromosomes associated with members of other multigene families, including stevor. Both PfEMP1 and STEVOR are expressed in gametocytes, the transmissible parasite stage, but the role of these proteins in the biology of sexual-stage parasites remains unknown. PfEMP1 may continue to mediate antigenic variation in gametocytes, which need to persist in the host for many days before reaching maturity. Using quantitative reverse transcription-PCR and Northern hybridization, we demonstrate that transcription of a defined subset of type C var loci occurs during gametocyte development in vitro. This transcriptional program occurs in gametocytes regardless of the var expression phenotype of their asexual progenitors and therefore is subject to regulatory processes distinct from those that manage antigenic variation in the asexual parasite. In contrast, the same stevor variants are transcribed in both gametocytes and their asexual progenitors. We also provide evidence that for both asexual parasites and gametocytes, var and stevor transcription patterns are not linked to each other.
Figures

Similar articles
-
Distinct trafficking and localization of STEVOR proteins in three stages of the Plasmodium falciparum life cycle.Infect Immun. 2004 Nov;72(11):6597-602. doi: 10.1128/IAI.72.11.6597-6602.2004. Infect Immun. 2004. PMID: 15501792 Free PMC article.
-
Transcription and coregulation of multigene families in Plasmodium falciparum.Trends Parasitol. 2007 May;23(5):183-6; discussion 186-7. doi: 10.1016/j.pt.2007.02.010. Epub 2007 Mar 9. Trends Parasitol. 2007. PMID: 17350338 Review.
-
Expression switching in the stevor and Pfmc-2TM superfamilies in Plasmodium falciparum.Mol Microbiol. 2007 Jun;64(6):1621-34. doi: 10.1111/j.1365-2958.2007.05767.x. Mol Microbiol. 2007. PMID: 17555442
-
The Plasmodium falciparum histone methyltransferase PfSET10 is dispensable for the regulation of antigenic variation and gene expression in blood-stage parasites.mSphere. 2024 Nov 21;9(11):e0054624. doi: 10.1128/msphere.00546-24. Epub 2024 Oct 24. mSphere. 2024. PMID: 39445826 Free PMC article.
-
[Var gene family and antigen variation in Plasmodium falciparum].Zhongguo Ji Sheng Chong Xue Yu Ji Sheng Chong Bing Za Zhi. 2010 Apr;28(2):153-6. Zhongguo Ji Sheng Chong Xue Yu Ji Sheng Chong Bing Za Zhi. 2010. PMID: 20666324 Review. Chinese.
Cited by
-
Sexual development in Plasmodium parasites: knowing when it's time to commit.Nat Rev Microbiol. 2015 Sep;13(9):573-87. doi: 10.1038/nrmicro3519. Nat Rev Microbiol. 2015. PMID: 26272409 Review.
-
Structure and non-essential function of glycerol kinase in Plasmodium falciparum blood stages.Mol Microbiol. 2009 Jan;71(2):533-45. doi: 10.1111/j.1365-2958.2008.06544.x. Epub 2008 Nov 24. Mol Microbiol. 2009. PMID: 19040641 Free PMC article.
-
Plasmodium falciparum STEVOR proteins impact erythrocyte mechanical properties.Blood. 2012 Jan 12;119(2):e1-8. doi: 10.1182/blood-2011-08-370734. Epub 2011 Nov 21. Blood. 2012. PMID: 22106347 Free PMC article.
-
Limited cross-reactivity among domains of the Plasmodium falciparum clone 3D7 erythrocyte membrane protein 1 family.Infect Immun. 2006 Dec;74(12):6778-84. doi: 10.1128/IAI.01187-06. Epub 2006 Oct 2. Infect Immun. 2006. PMID: 17015460 Free PMC article.
-
Chromatin-mediated epigenetic regulation in the malaria parasite Plasmodium falciparum.Eukaryot Cell. 2010 Aug;9(8):1138-49. doi: 10.1128/EC.00036-10. Epub 2010 May 7. Eukaryot Cell. 2010. PMID: 20453074 Free PMC article. Review.
References
-
- Baruch, D. I., B. L. Pasloske, H. D. Singh, B. Xiahui, X. C. Ma, M. Feldman, T. F. Taraschi, and R. J. Howard. 1995. Cloning the Plasmodium falciparum gene encoding PfEMP1, a malarial variant antigen and adherence receptor on the surface of parasitised human erythrocytes. Cell 82:77-87. - PubMed
-
- Day, K. P., R. E. Hayward, D. Smith, and J. G. Culvenor. 1998. CD36-dependent adhesion and knob expression of the transmission stages of Plasmodium falciparum is stage specific. Mol. Biochem. Parasitol. 93:167-177. - PubMed
-
- Dyer, M., and K. P. Day. 2003. Regulation of the rate of asexual growth and commitment to sexual development by diffusible factors from in vitro cultures of Plasmodium falciparum. Am. J. Trop. Med. Hyg. 68:403-409. - PubMed
Publication types
MeSH terms
Substances
Grants and funding
LinkOut - more resources
Full Text Sources
Research Materials
