Comparative Study
. 2006 Aug;141(4):1167-84.
doi: 10.1104/pp.106.080580.

Genome-wide analysis of basic/helix-loop-helix transcription factor family in rice and Arabidopsis

Affiliations
Comparative Study

Genome-wide analysis of basic/helix-loop-helix transcription factor family in rice and Arabidopsis

Xiaoxing Li et al. Plant Physiol. 2006 Aug.

Abstract

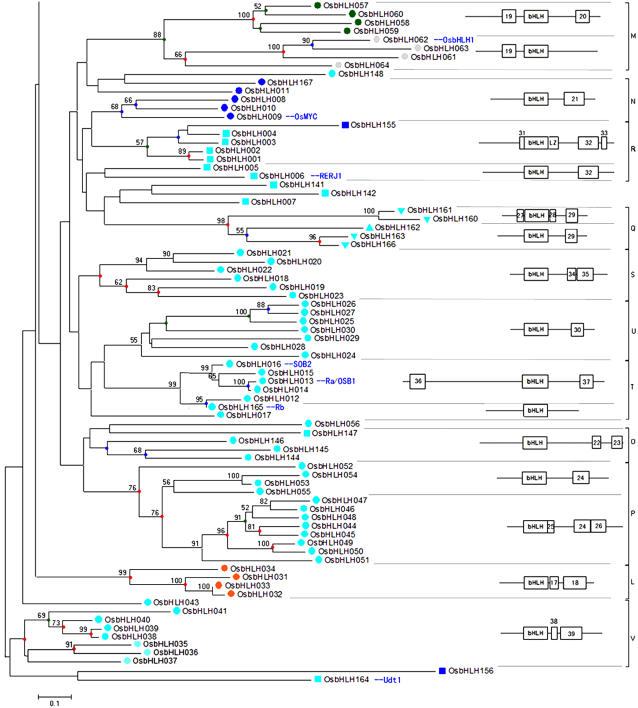
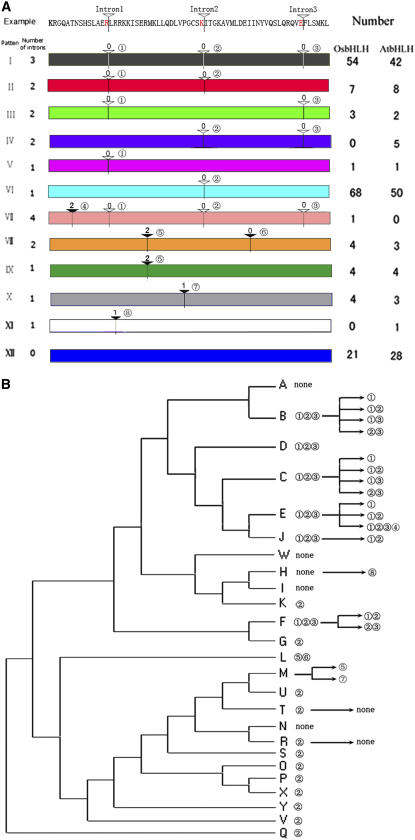
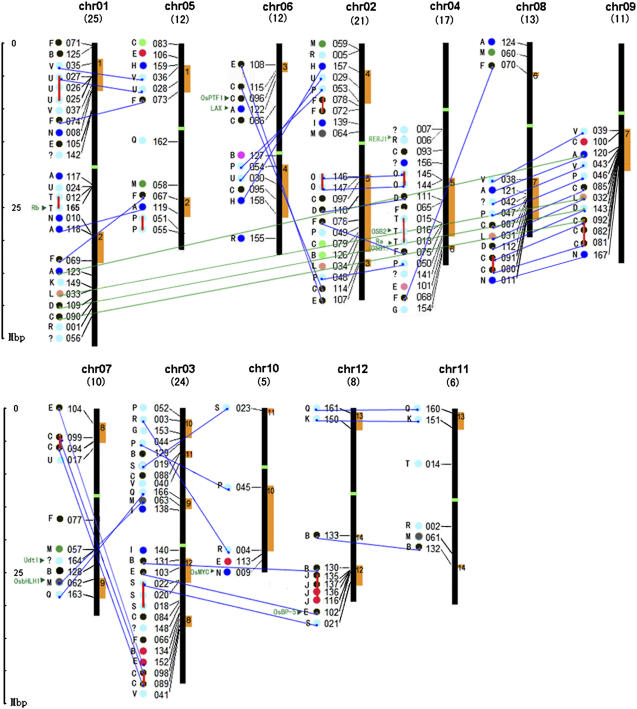
The basic/helix-loop-helix (bHLH) transcription factors and their homologs form a large family in plant and animal genomes. They are known to play important roles in the specification of tissue types in animals. On the other hand, few plant bHLH proteins have been studied functionally. Recent completion of whole genome sequences of model plants Arabidopsis (Arabidopsis thaliana) and rice (Oryza sativa) allows genome-wide analysis and comparison of the bHLH family in flowering plants. We have identified 167 bHLH genes in the rice genome, and their phylogenetic analysis indicates that they form well-supported clades, which are defined as subfamilies. In addition, sequence analysis of potential DNA-binding activity, the sequence motifs outside the bHLH domain, and the conservation of intron/exon structural patterns further support the evolutionary relationships among these proteins. The genome distribution of rice bHLH genes strongly supports the hypothesis that genome-wide and tandem duplication contributed to the expansion of the bHLH gene family, consistent with the birth-and-death theory of gene family evolution. Bioinformatics analysis suggests that rice bHLH proteins can potentially participate in a variety of combinatorial interactions, endowing them with the capacity to regulate a multitude of transcriptional programs. In addition, similar expression patterns suggest functional conservation between some rice bHLH genes and their close Arabidopsis homologs.


Figures

Figure 1.
Figure 1.
Distribution of amino acids in the bHLH consensus motif. In columns labeled a, percentages refer to the 392 bHLH proteins analyzed by Atchley et al. (1999). In columns labeled b, percentages refer to the 147 AtbHLH proteins identified by Toledo-Ortiz et al. (2003). In columns labeled c, percentages refer to the 167 OsbHLH proteins identified in this study. More than 10% of some of the residues presented in columns b or c, which were absent in the defined consensus motif in column a, are also indicated. The numbers below a, b, and c refer to the positions of the residues in the alignments of the studies.
Figure 2.
Figure 2.
Predicted DNA-binding characteristics of the bHLH domain of OsbHLH and AtbHLH proteins. The asterisk (*) indicates that the data for AtbHLHs were from Toledo-Ortiz et al. (2003), and the figure is modeled after table III in Toledo-Ortiz et al. (2003).
Figure 3.
Figure 3.
NJ phylogenetic tree of the OsbHLH members. This tree indicates the predicted DNA-binding activities, the intron distribution pattern, and the conservative sequence out of the bHLH domain. The unrooted tree, constructed using MEGA 3.0, summarizes the evolutionary relationships among the 167 members of the OsbHLH protein family. The proteins are named according to OsbHLH numbers (see Supplemental Fig. 1; Table I). The colorful dots on the nodes indicate the bootstrap values of the tree, which is built by the maximum parsimony method. The variation rates across the amino acid positions were shown by the length of the branch. The tree shows the 22 phylogenetic subfamilies (A–V) with high predictive value. The bootstrap values lower than 50 are not shown in the phylogenetic tree. The markers in front of the OsbHLH numbers indicate the predicted DNA-binding activity of each protein, i.e. the roundish marker indicates putative G-box binders, the square marker indicates putative non-G-box but E-box binders, the triangle marker indicates putative non-E-box binders (i.e. possible DNA-binding capacity but no predicted recognition of an E box), and the upside-down triangle marker indicates putative non-DNA binders (see Fig. 2 for categories). The colors of these markers indicate the numbers and positions of the introns localized in the bHLH domain of each protein, which are identical to those of the intron patterns shown in Figure 4. The conserved motifs outside bHLH domain among the members of the same subfamilies are highlighted in white boxes with an arranged number, and the same number referred to the same motif, except the bHLH domain and L-ZIP (LZ) indicated directly in the figure, and motif sequences with best possible match were shown in Supplemental Table III. This figure is modeled after figure 4 in Heim et al. (2003).
Figure 3.
Figure 3.
NJ phylogenetic tree of the OsbHLH members. This tree indicates the predicted DNA-binding activities, the intron distribution pattern, and the conservative sequence out of the bHLH domain. The unrooted tree, constructed using MEGA 3.0, summarizes the evolutionary relationships among the 167 members of the OsbHLH protein family. The proteins are named according to OsbHLH numbers (see Supplemental Fig. 1; Table I). The colorful dots on the nodes indicate the bootstrap values of the tree, which is built by the maximum parsimony method. The variation rates across the amino acid positions were shown by the length of the branch. The tree shows the 22 phylogenetic subfamilies (A–V) with high predictive value. The bootstrap values lower than 50 are not shown in the phylogenetic tree. The markers in front of the OsbHLH numbers indicate the predicted DNA-binding activity of each protein, i.e. the roundish marker indicates putative G-box binders, the square marker indicates putative non-G-box but E-box binders, the triangle marker indicates putative non-E-box binders (i.e. possible DNA-binding capacity but no predicted recognition of an E box), and the upside-down triangle marker indicates putative non-DNA binders (see Fig. 2 for categories). The colors of these markers indicate the numbers and positions of the introns localized in the bHLH domain of each protein, which are identical to those of the intron patterns shown in Figure 4. The conserved motifs outside bHLH domain among the members of the same subfamilies are highlighted in white boxes with an arranged number, and the same number referred to the same motif, except the bHLH domain and L-ZIP (LZ) indicated directly in the figure, and motif sequences with best possible match were shown in Supplemental Table III. This figure is modeled after figure 4 in Heim et al. (2003).
Figure 4.
Figure 4.
Intron distribution within the bHLH domains of the OsbHLH and AtbHLH proteins. A, Scheme of the intron distribution patterns (color coded and designated I–XII) within the bHLH domains of the OsbHLH proteins. The white triangles are used when the position of the intron coincides with the example. The black triangles indicate that the location of the intron within the bHLH domain is different from the example. The numbers above the triangles indicate the splicing phases of the bHLH domain sequences, 0 refers to phase 0, 1 to phase 1, and 2 to phase 2. The markers 1 to 8 beside the triangles show different positions of the introns. The number of proteins with each pattern is given at right. The correlation of intron distribution patterns and phylogenetic subfamilies is provided in Figure 3 (in different color marker in front of the OsbHLH number). The result of introns in the variable loop region has been adjusted by eye to make the result more contracted. This figure is modeled after figure 3 in Toledo-Ortiz et al. (2003). B, The intron pattern of bHLH domains in different subfamilies of OsbHLH and AtbHLH proteins. Topology of this tree is based on the phylogenetic tree of Figure 6. The markers 1 to 8 are the same as in Figure 4A.
Figure 5.
Figure 5.
Chromosomal locations, region duplication, and predicted cluster for OsbHLH genes. Chromosomal positions of the OsbHLH genes are indicated by OsbHLH number (assigned in Table I). The scale is in megabases (Mb). The numbers below the name of the chromosome show the number of OsbHLH genes in this chromosome. The colorful marker in front of the OsbHLH number is the same with the color of their intron distribution pattern in Figure 4. The letter in front of the colorful marker shows the phylogenetic category of the gene (Fig. 3) and the unclassified member is denoted as a question mark (?). The green bars in the middle of the 12 chromosomes show the rough position of the centromerics according to the sequencing result of IRGSP (2005). Each pair of duplicated bHLH genes is connected with a blue line. Connecting lines mark the specific cases in which there is a strong correlation between duplicated genomic regions and the presence of bHLH genes with closely related predicted amino acid sequences (OsbHLH members in the same family). The red lines connect the predicted gene cluster with high sequence similarity and close chromosome locations. The probable hidden duplicated bHLHs are linked using a green line. The orange and red bars beside the chromosomes indicate the 14 duplication regions predicted in this study. The predicted earlier duplication of region 7 was shown in the yellow bar. This figure is adopted from figure 4 of Toledo-Ortiz et al. (2003).
Figure 6.
Figure 6.
NJ phylogenetic tree of the AtbHLH and OsbHLH domains and expression patterns for Arabidopsis and rice bHLH genes from RT-PCR, microarray, and EST data. The letter R above the column of expression data refers to root, S refers to stem, L refers to leaf, and F refers to flower and seed (silique). The black and white blocks in the right column (length of exon and intron) indicate the DNA sequence length of each bHLH domain. The white blocks indicate introns and the black blocks indicate exons. The bar above the column indicates length of the sequences. The colors of the markers in front of the bHLH numbers, which correspond with those in Figure 4, also indicate the numbers and positions of the introns localized in the bHLH domain of each protein. The names of the subfamilies divided by Buck and Atchley (2003) are also listed after the clade names of this study. The AtbHLH protein names are abbreviated as follows: BEE, Brassinosteroid enhanced expression; PIF, phytochrome-interacting factor; TT8, transparent testa8, GL3, GLABRA3; EGL3, enhancer of GLABRA3; AMS, aborted microspores; ICE1, inducer of CBF expression1; HFR1, long hypocotyl in far red1. The OsbHLH110 has three introns, but only two introns could be seen in the figure. The third predicted intron of the OsbHLH110 is too short (only 9 bp) to display in the figure. The third intron (5,273 bp) of bHLH domain of OsbHLH076 and the single intron (5,571 bp) of bHLH domain of OsbHLH064 are too long to show the full length in the figure, so part of the block is replaced by the symbol of suspension points (……).
Figure 6.
Figure 6.
NJ phylogenetic tree of the AtbHLH and OsbHLH domains and expression patterns for Arabidopsis and rice bHLH genes from RT-PCR, microarray, and EST data. The letter R above the column of expression data refers to root, S refers to stem, L refers to leaf, and F refers to flower and seed (silique). The black and white blocks in the right column (length of exon and intron) indicate the DNA sequence length of each bHLH domain. The white blocks indicate introns and the black blocks indicate exons. The bar above the column indicates length of the sequences. The colors of the markers in front of the bHLH numbers, which correspond with those in Figure 4, also indicate the numbers and positions of the introns localized in the bHLH domain of each protein. The names of the subfamilies divided by Buck and Atchley (2003) are also listed after the clade names of this study. The AtbHLH protein names are abbreviated as follows: BEE, Brassinosteroid enhanced expression; PIF, phytochrome-interacting factor; TT8, transparent testa8, GL3, GLABRA3; EGL3, enhancer of GLABRA3; AMS, aborted microspores; ICE1, inducer of CBF expression1; HFR1, long hypocotyl in far red1. The OsbHLH110 has three introns, but only two introns could be seen in the figure. The third predicted intron of the OsbHLH110 is too short (only 9 bp) to display in the figure. The third intron (5,273 bp) of bHLH domain of OsbHLH076 and the single intron (5,571 bp) of bHLH domain of OsbHLH064 are too long to show the full length in the figure, so part of the block is replaced by the symbol of suspension points (……).

References

    1. Abe H, Urao T, Ito T, Seki M, Shinozaki K, Yamaguchi-Shinozaki K (2003) Arabidopsis AtMYC2 (bHLH) and AtMYB2 (MYB) function as transcriptional activators in abscisic acid signaling. Plant Cell 15: 63–78 - PMC - PubMed
    1. Altschul SF, Gish W, Miller W, Myers EW, Lipman DJ (1990) Basic local alignment search tool. J Mol Biol 215: 403–410 - PubMed
    1. Altschul SF, Madden TL, Schaffer AA, Zhang J, Zhang Z, Miller W, Lipman DJ (1997) Gapped BLAST and PSI-BLAST: a new generation of protein database search programs. Nucleic Acids Res 25: 3389–3402 - PMC - PubMed
    1. Atchley WR, Fitch WM (1997) A natural classification of the basic helix-loop-helix class of transcription factors. Proc Natl Acad Sci USA 94: 5172–5176 - PMC - PubMed
    1. Atchley WR, Terhalle W, Dress A (1999) Positional dependence, cliques, and predictive motifs in the bHLH protein domain. J Mol Evol 48: 501–516 - PubMed

Publication types

MeSH terms

Substances

LinkOut - more resources