

Regression of alterations in retinal microcirculation following treatment for arterial hypertension
- PMID: 16896275
- PMCID: PMC8109541
- DOI: 10.1111/j.1524-6175.2006.05476.x
Regression of alterations in retinal microcirculation following treatment for arterial hypertension
Abstract
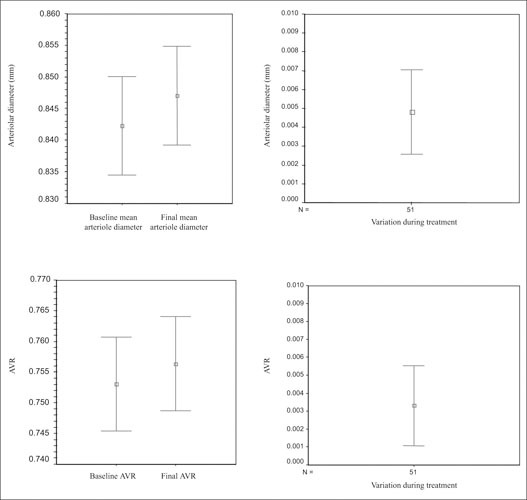
Evaluation of early hypertension-related alterations in retinal microcirculation has been subjective and poorly reproducible. The authors recently described a semiautomatic computerized system for evaluation of the calibre of retinal blood vessels that has shown very good reproducibility. In the study, this system was used to measure the calibres of retinal arterioles and veins, and their ratio, in a group of 51 hypertensive outpatients before and after 6 months of treatment with losartan or, if required for satisfactory blood pressure control, losartan plus hydrochlorothiazide. Mean retinal arteriole diameter increased from 0.0842 +/- 0.003 mm to 0.0847 +/- 0.003 mm (p = 0.001). Arteriovenous ratio increased from 0.753 +/- 0.03 to 0.756 +/- 0.03 (p = 0.005). This observation suggests regression of early hypertension-related alterations in retinal microcirculation after 6 months of antihypertensive treatment.
Figures
Similar articles
-
Factors associated with changes in retinal microcirculation after antihypertensive treatment.J Hum Hypertens. 2014 May;28(5):310-5. doi: 10.1038/jhh.2013.108. Epub 2013 Nov 21. J Hum Hypertens. 2014. PMID: 24257513
-
[Relation between changes in retinal microcirculation and other organ damage in hypertension and regression with antihypertensive treatment].Med Clin (Barc). 2007 Apr 28;128(16):605-8. doi: 10.1157/13101743. Med Clin (Barc). 2007. PMID: 17524317 Spanish.
-
Effects of losartan titrated to losartan/hydrochlorothiazide and amlodipine on blood pressure and peripheral capillary microcirculation in patients with mild-to-moderate hypertension.J Hum Hypertens. 1998 Jul;12(7):473-8. doi: 10.1038/sj.jhh.1000647. J Hum Hypertens. 1998. PMID: 9702934 Clinical Trial.
-
[Useful parameters for the management of hypertensive patients].Med Clin (Barc). 2002 Oct 5;119(11):423-8. doi: 10.1016/s0025-7753(02)73439-8. Med Clin (Barc). 2002. PMID: 12381278 Review. Spanish. No abstract available.
-
The heart, macrocirculation and microcirculation in hypertension: a unifying hypothesis.J Hypertens Suppl. 2003 Jun;21(3):S19-23. doi: 10.1097/00004872-200306003-00004. J Hypertens Suppl. 2003. PMID: 12929471 Review.
Cited by
-
Association Between Blood Pressure and Retinal Vessel Diameters Among Police Officers in the US Northeast.J Occup Environ Med. 2018 Mar;60(3):234-240. doi: 10.1097/JOM.0000000000001246. J Occup Environ Med. 2018. PMID: 29227361 Free PMC article.
-
On redefining hypertension.Tex Heart Inst J. 2010;37(4):439-41. Tex Heart Inst J. 2010. PMID: 20844617 Free PMC article. No abstract available.
-
Retinal vascular tortuosity assessment: inter-intra expert analysis and correlation with computational measurements.BMC Med Res Methodol. 2018 Nov 20;18(1):144. doi: 10.1186/s12874-018-0598-3. BMC Med Res Methodol. 2018. PMID: 30458717 Free PMC article.
-
Factors associated with changes in retinal microcirculation after antihypertensive treatment.J Hum Hypertens. 2014 May;28(5):310-5. doi: 10.1038/jhh.2013.108. Epub 2013 Nov 21. J Hum Hypertens. 2014. PMID: 24257513
-
Relationship of blood pressure to retinal vessel diameter in type 1 diabetes mellitus.Arch Ophthalmol. 2010 Feb;128(2):198-205. doi: 10.1001/archophthalmol.2009.391. Arch Ophthalmol. 2010. PMID: 20142543 Free PMC article. Clinical Trial.
References
-
- Seventh Report of the National Committee on Prevention, Detection, Evaluation, and Treatment of High Blood Pressure: the JNC 7 report [published correction appears in JAMA. 2003; 290:197]. JAMA. 2003;289:2560–2572. - PubMed
-
- 2003 European Society of Hypertension‐European Society of Cardiology guidelines for the management of arterial hypertension. J Hypertens. 2003;21:1011–1053. - PubMed
-
- Cuspidi C, Macca G, Salerno M, et al. Evaluation of target organ damage in arterial hypertension: which role for qualitative funduscopic examination? Ital Heart J. 2001;2:702–706. - PubMed
-
- Pose‐Reino A, Gómez‐Ulla F, Hayik B, et al. Computerized measurement of retinal blood vessel calibre: description, validation and use to determine the influence of ageing and hypertension. J Hypertens. 2005;23:843–850. - PubMed
-
- Ganau A, Devereux RB, Roman MJ, et al. Patterns of left ventricular hypertrophy and geometric remodeling in essential hypertension. J Am Coll Cardiol. 1992;19:1550–1558. - PubMed
Publication types
MeSH terms
Substances
LinkOut - more resources
Full Text Sources
Other Literature Sources
Medical
