

Computer-aided diagnosis of pulmonary nodules on CT scans: segmentation and classification using 3D active contours
- PMID: 16898434
- PMCID: PMC2728558
- DOI: 10.1118/1.2207129
Computer-aided diagnosis of pulmonary nodules on CT scans: segmentation and classification using 3D active contours
Abstract
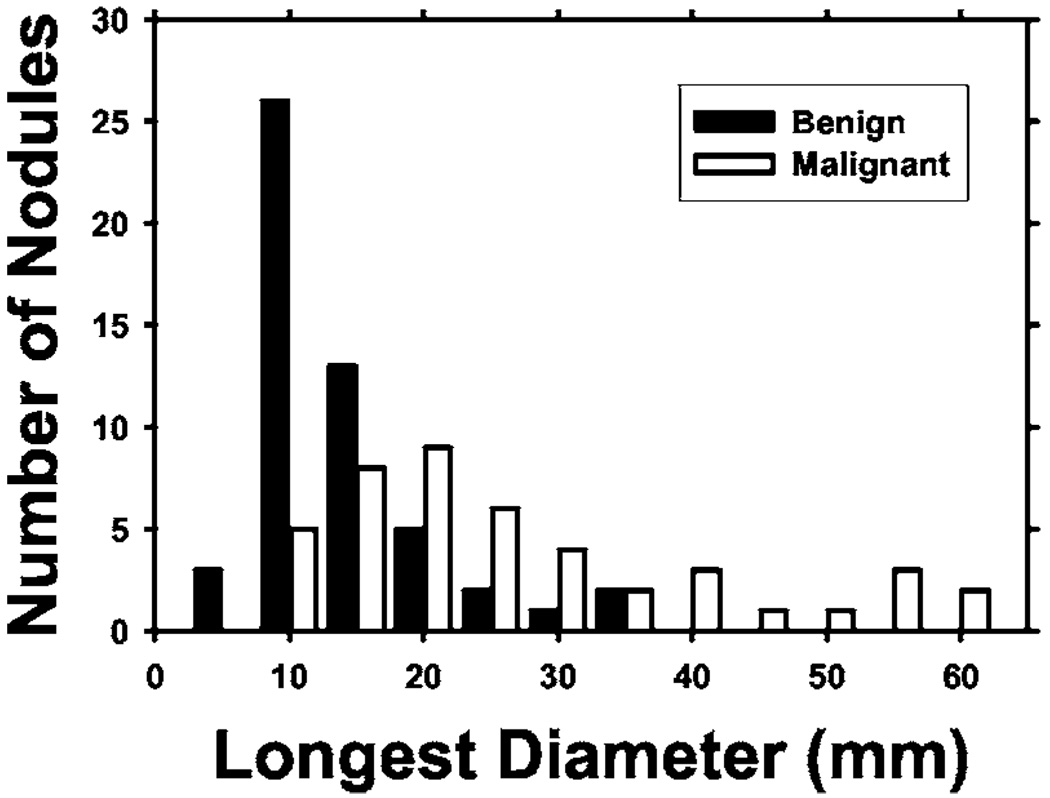
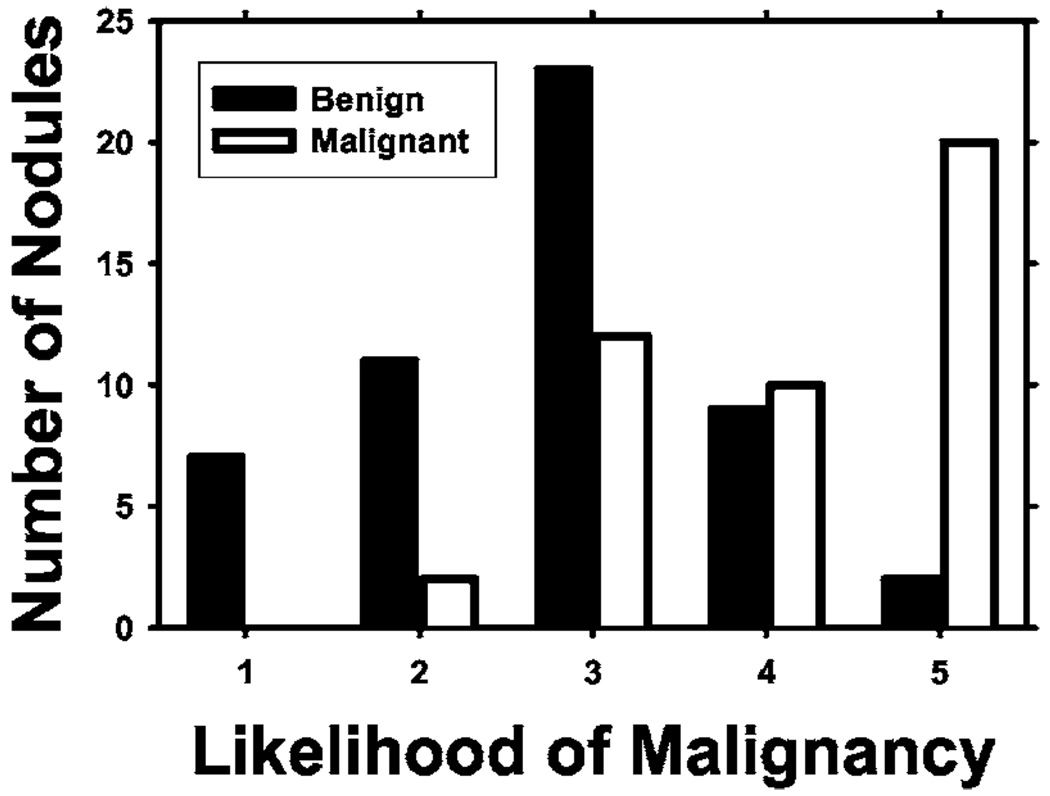
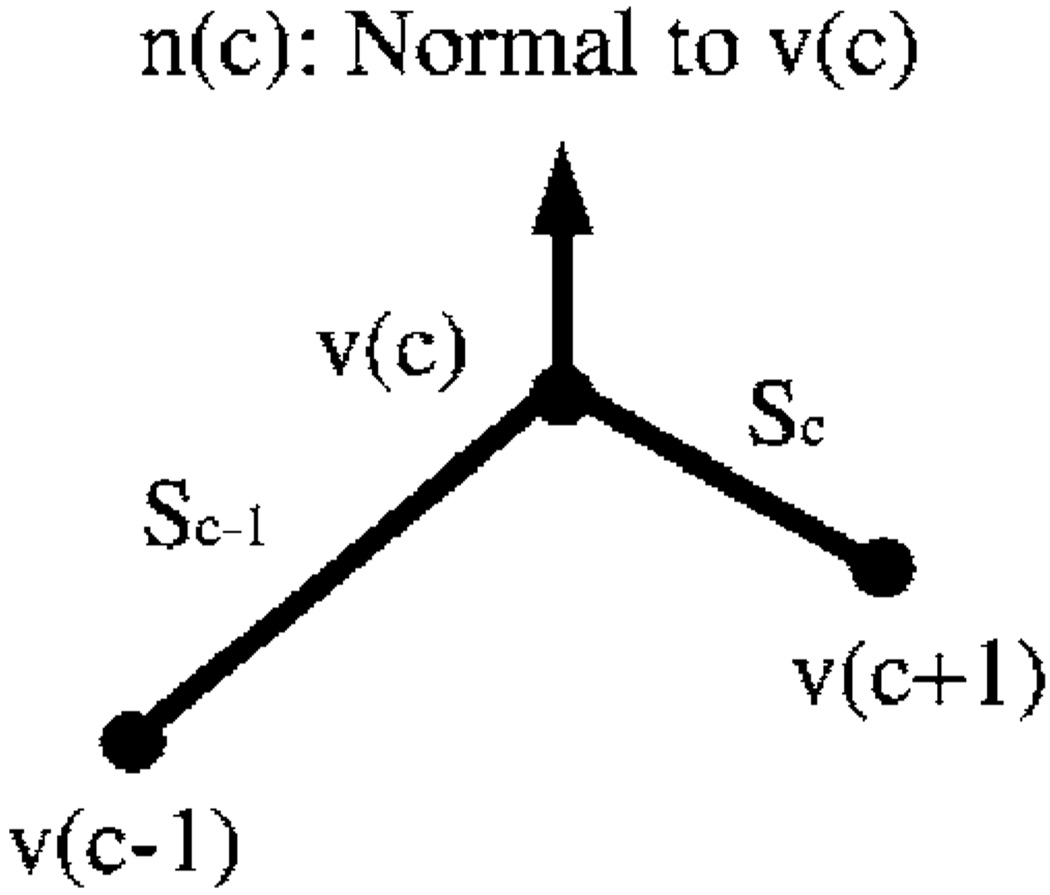
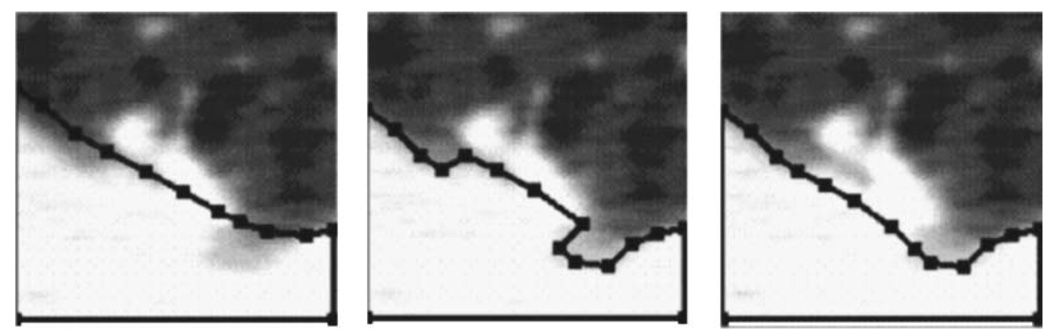
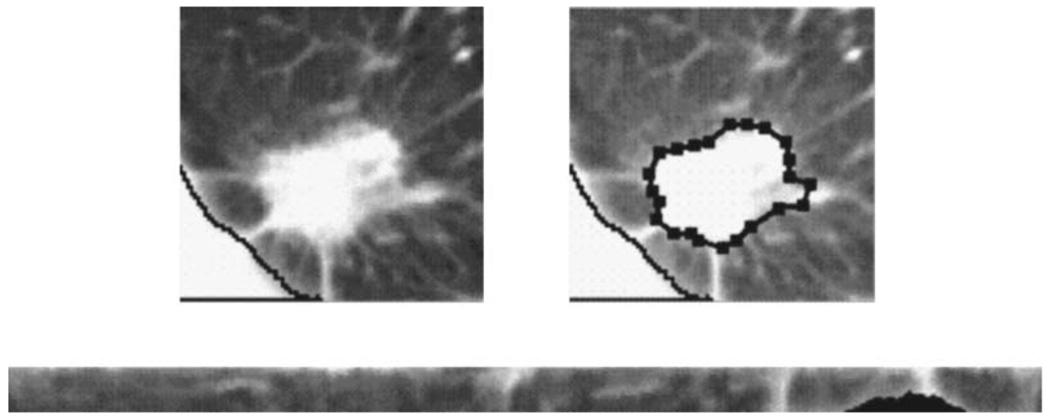
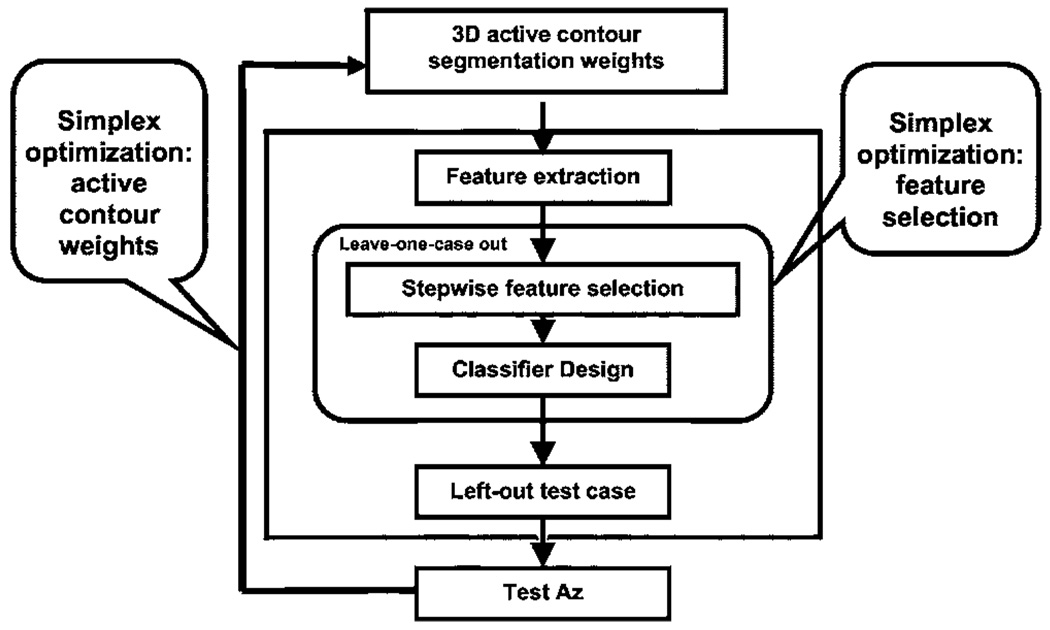
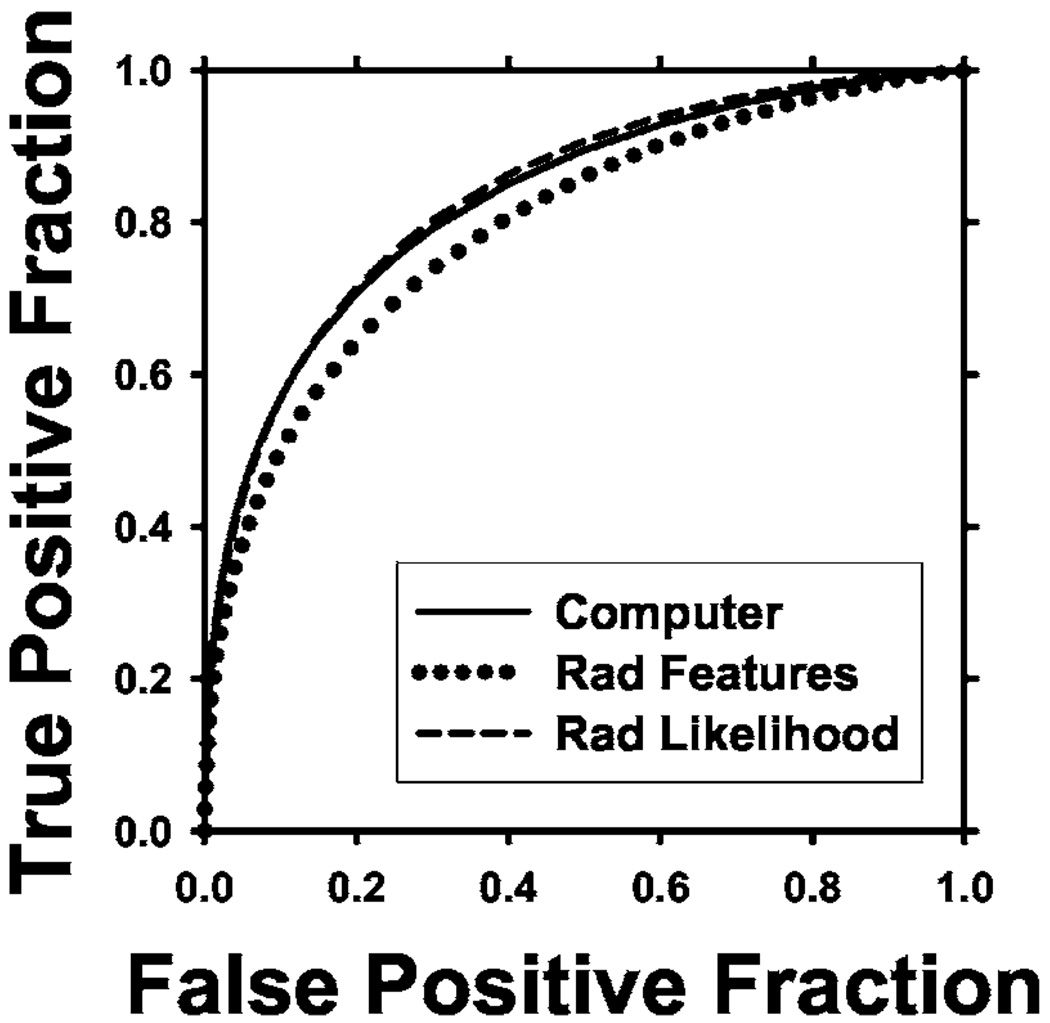
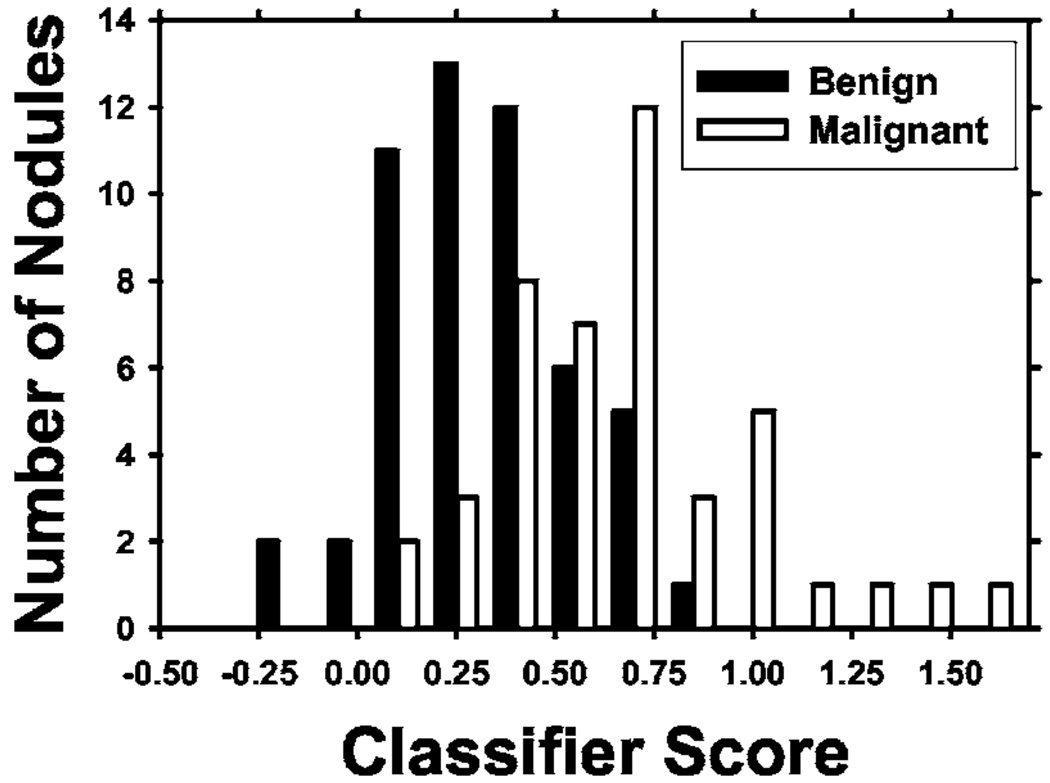
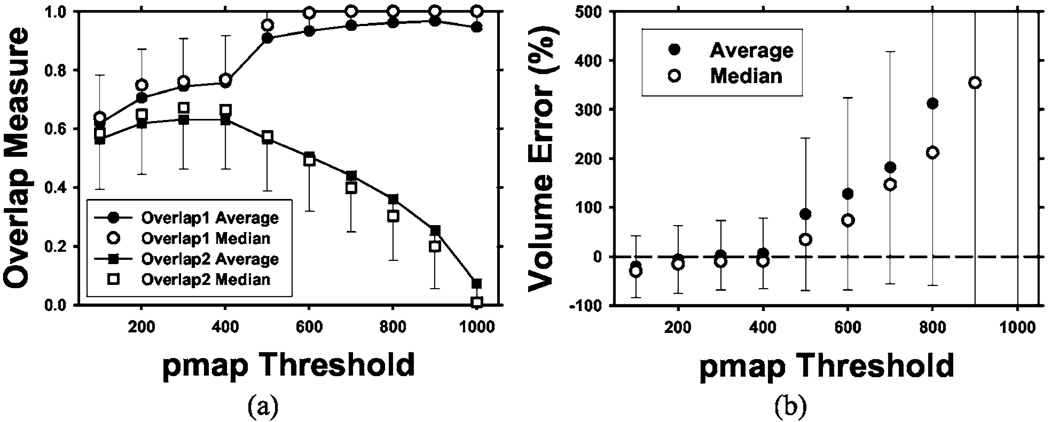
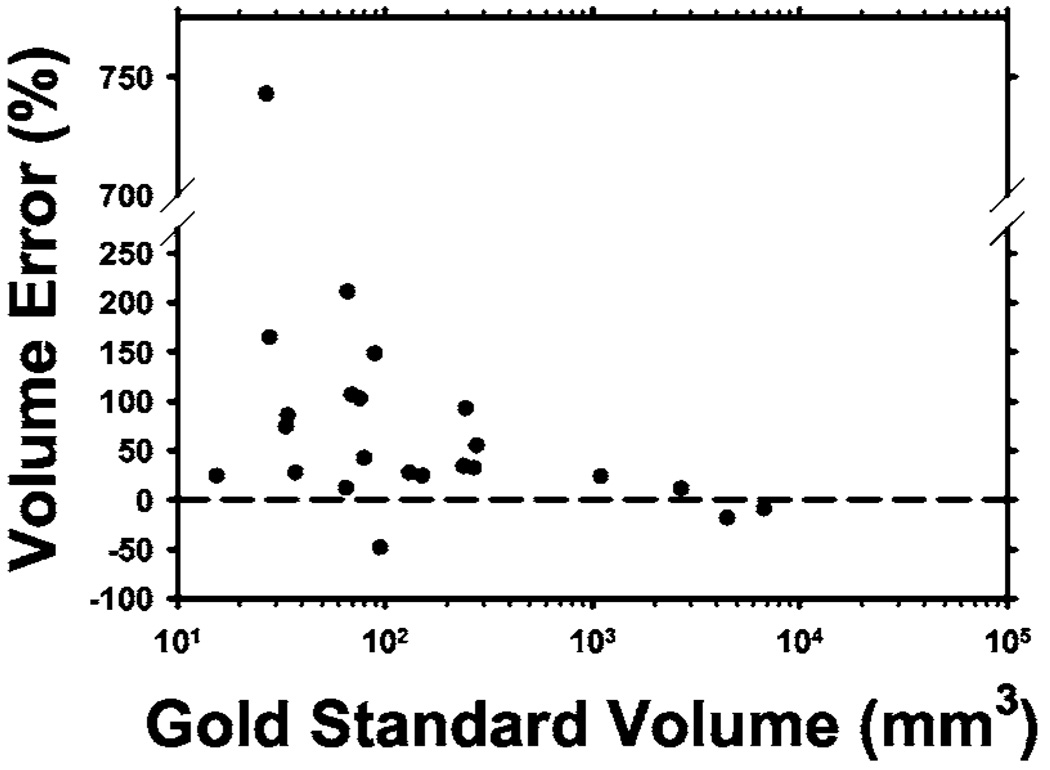
We are developing a computer-aided diagnosis (CAD) system to classify malignant and benign lung nodules found on CT scans. A fully automated system was designed to segment the nodule from its surrounding structured background in a local volume of interest (VOI) and to extract image features for classification. Image segmentation was performed with a three-dimensional (3D) active contour (AC) method. A data set of 96 lung nodules (44 malignant, 52 benign) from 58 patients was used in this study. The 3D AC model is based on two-dimensional AC with the addition of three new energy components to take advantage of 3D information: (1) 3D gradient, which guides the active contour to seek the object surface, (2) 3D curvature, which imposes a smoothness constraint in the z direction, and (3) mask energy, which penalizes contours that grow beyond the pleura or thoracic wall. The search for the best energy weights in the 3D AC model was guided by a simplex optimization method. Morphological and gray-level features were extracted from the segmented nodule. The rubber band straightening transform (RBST) was applied to the shell of voxels surrounding the nodule. Texture features based on run-length statistics were extracted from the RBST image. A linear discriminant analysis classifier with stepwise feature selection was designed using a second simplex optimization to select the most effective features. Leave-one-case-out resampling was used to train and test the CAD system. The system achieved a test area under the receiver operating characteristic curve (A(z)) of 0.83 +/- 0.04. Our preliminary results indicate that use of the 3D AC model and the 3D texture features surrounding the nodule is a promising approach to the segmentation and classification of lung nodules with CAD. The segmentation performance of the 3D AC model trained with our data set was evaluated with 23 nodules available in the Lung Image Database Consortium (LIDC). The lung nodule volumes segmented by the 3D AC model for best classification were generally larger than those outlined by the LIDC radiologists using visual judgment of nodule boundaries.
Figures
Similar articles
-
Computer-aided diagnosis of pulmonary nodules on CT scans: improvement of classification performance with nodule surface features.Med Phys. 2009 Jul;36(7):3086-98. doi: 10.1118/1.3140589. Med Phys. 2009. PMID: 19673208 Free PMC article.
-
An integrated segmentation and shape-based classification scheme for distinguishing adenocarcinomas from granulomas on lung CT.Med Phys. 2017 Jul;44(7):3556-3569. doi: 10.1002/mp.12208. Epub 2017 May 23. Med Phys. 2017. PMID: 28295386 Free PMC article.
-
Automatic detection of lung nodules in CT datasets based on stable 3D mass-spring models.Comput Biol Med. 2012 Nov;42(11):1098-109. doi: 10.1016/j.compbiomed.2012.09.002. Epub 2012 Sep 26. Comput Biol Med. 2012. PMID: 23020972
-
[CAD for identifying malignant lung nodules in early diagnosis: a survey].Sheng Wu Yi Xue Gong Cheng Xue Za Zhi. 2009 Oct;26(5):1141-5, 1157. Sheng Wu Yi Xue Gong Cheng Xue Za Zhi. 2009. PMID: 19947507 Review. Chinese.
-
Recent technological and application developments in computed tomography and magnetic resonance imaging for improved pulmonary nodule detection and lung cancer staging.J Magn Reson Imaging. 2010 Dec;32(6):1353-69. doi: 10.1002/jmri.22383. J Magn Reson Imaging. 2010. PMID: 21105140 Free PMC article. Review.
Cited by
-
Stability and reproducibility of computed tomography radiomic features extracted from peritumoral regions of lung cancer lesions.Med Phys. 2019 Nov;46(11):5075-5085. doi: 10.1002/mp.13808. Epub 2019 Sep 23. Med Phys. 2019. PMID: 31494946 Free PMC article.
-
Survival Prediction of Patients with Bladder Cancer after Cystectomy Based on Clinical, Radiomics, and Deep-Learning Descriptors.Cancers (Basel). 2023 Sep 1;15(17):4372. doi: 10.3390/cancers15174372. Cancers (Basel). 2023. PMID: 37686647 Free PMC article.
-
Added Value of Computer-aided CT Image Features for Early Lung Cancer Diagnosis with Small Pulmonary Nodules: A Matched Case-Control Study.Radiology. 2018 Jan;286(1):286-295. doi: 10.1148/radiol.2017162725. Epub 2017 Sep 5. Radiology. 2018. PMID: 28872442 Free PMC article.
-
An Appraisal of Lung Nodules Automatic Classification Algorithms for CT Images.Sensors (Basel). 2019 Jan 7;19(1):194. doi: 10.3390/s19010194. Sensors (Basel). 2019. PMID: 30621101 Free PMC article. Review.
-
Radiomics analysis of pulmonary nodules in low-dose CT for early detection of lung cancer.Med Phys. 2018 Apr;45(4):1537-1549. doi: 10.1002/mp.12820. Epub 2018 Mar 12. Med Phys. 2018. PMID: 29457229 Free PMC article.
References
-
- American Cancer Society. Cancer Facts & Figures. 2005. www.cancer.org2005.
-
- Swensen SJ, Viggiano RW, Midthun DE, Müller NL, Sherrick A, Yamashita K, Naidich DP, Patz EF, Hartman TE, Muhm JR, et al. Lung nodule enhancement at CT: Multicenter study. Radiology. 2000;214:73–80. - PubMed
-
- Henschke CI, McCauley DI, Yankelevitz DF, Naidich DP, McGuinness G, Miettinen OS, Libby DM, Pasmantier MW, Koizumi J, Altorki NK, et al. Early lung cancer action project: Overall design and findings from baseline screening. Lancet. 1999;354:99–105. - PubMed
-
- Diederich S, Wormanns D, Semik M, Thomas M, Lenzen H, Roos N, Heindel W. Screening for early lung cancer with low-dose spiral CT: Prevalence in 817 asymptomatic smokers. Radiology. 2002;222:773–781. - PubMed
-
- Kaneko M, Eguchi K, Ohmatsu H, Kakinuma R, Naruke T, Suemasu K, Moriyama N. Peripheral lung cancer: Screening and detection with low-dose spiral CT versus radiography. Radiology. 1996;201:798–802. - PubMed
Publication types
MeSH terms
Grants and funding
LinkOut - more resources
Full Text Sources
Other Literature Sources
Medical
Miscellaneous
