Joint two-view information for computerized detection of microcalcifications on mammograms
- PMID: 16898462
- PMCID: PMC3026322
- DOI: 10.1118/1.2208919
Joint two-view information for computerized detection of microcalcifications on mammograms
Abstract
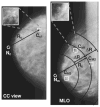
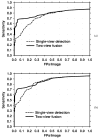
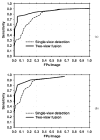
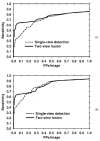
We are developing new techniques to improve the accuracy of computerized microcalcification detection by using the joint two-view information on craniocaudal (CC) and mediolateral-oblique (MLO) views. After cluster candidates were detected using a single-view detection technique, candidates on CC and MLO views were paired using their radial distances from the nipple. Candidate pairs were classified with a similarity classifier that used the joint information from both views. Each cluster candidate was also characterized by its single-view features. The outputs of the similarity classifier and the single-view classifier were fused and the cluster candidate was classified as a true microcalcification cluster or a false-positive (FP) using the fused two-view information. A data set of 116 pairs of mammograms containing microcalcification clusters and 203 pairs of normal images from the University of South Florida (USF) public database was used for training the two-view detection algorithm. The trained method was tested on an independent test set of 167 pairs of mammograms, which contained 71 normal pairs and 96 pairs with microcalcification clusters collected at the University of Michigan (UM). The similarity classifier had a very low FP rate for the test set at low and medium levels of sensitivity. However, the highest mammogram-based sensitivity that could be reached by the similarity classifier was 69%. The single-view classifier had a higher FP rate compared to the similarity classifier, but it could reach a maximum mammogram-based sensitivity of 93%. The fusion method combined the scores of these two classifiers so that the number of FPs was substantially reduced at relatively low and medium sensitivities, and a relatively high maximum sensitivity was maintained. For the malignant microcalcification clusters, at a mammogram-based sensitivity of 80%, the FP rates were 0.18 and 0.35 with the two-view fusion and single-view detection methods, respectively. When the training and test sets were switched, a similar improvement was obtained, except that both the fusion and single-view detection methods had superior test performances on the USF data set than those on the UM data set. Our results indicate that correspondence of cluster candidates on two different views provides valuable additional information for distinguishing FPs from true microcalcification clusters.
Figures


Similar articles
-
Automated regional registration and characterization of corresponding microcalcification clusters on temporal pairs of mammograms for interval change analysis.Med Phys. 2008 Dec;35(12):5340-50. doi: 10.1118/1.3002311. Med Phys. 2008. PMID: 19175093 Free PMC article.
-
Computer aided detection of clusters of microcalcifications on full field digital mammograms.Med Phys. 2006 Aug;33(8):2975-88. doi: 10.1118/1.2211710. Med Phys. 2006. PMID: 16964876
-
Computer-aided detection of clustered microcalcifications in digital breast tomosynthesis: a 3D approach.Med Phys. 2012 Jan;39(1):28-39. doi: 10.1118/1.3662072. Med Phys. 2012. PMID: 22225272 Free PMC article.
-
Bilateral analysis based false positive reduction for computer-aided mass detection.Med Phys. 2007 Aug;34(8):3334-44. doi: 10.1118/1.2756612. Med Phys. 2007. PMID: 17879797 Free PMC article.
-
Strategies to Increase Cancer Detection: Review of True-Positive and False-Negative Results at Digital Breast Tomosynthesis Screening.Radiographics. 2016 Nov-Dec;36(7):1954-1965. doi: 10.1148/rg.2016160049. Epub 2016 Oct 7. Radiographics. 2016. PMID: 27715711 Free PMC article. Review.
Cited by
-
Matching breast masses depicted on different views a comparison of three methods.Acad Radiol. 2009 Nov;16(11):1338-47. doi: 10.1016/j.acra.2009.05.005. Epub 2009 Jul 25. Acad Radiol. 2009. PMID: 19632867 Free PMC article.
-
Computer-assisted detection of infectious lung diseases: a review.Comput Med Imaging Graph. 2012 Jan;36(1):72-84. doi: 10.1016/j.compmedimag.2011.06.002. Epub 2011 Jul 1. Comput Med Imaging Graph. 2012. PMID: 21723090 Free PMC article. Review.
-
Automated breast mass detection in 3D reconstructed tomosynthesis volumes: a featureless approach.Med Phys. 2008 Aug;35(8):3626-36. doi: 10.1118/1.2953562. Med Phys. 2008. PMID: 18777923 Free PMC article.
-
Computerized image analysis: texture-field orientation method for pectoral muscle identification on MLO-view mammograms.Med Phys. 2010 May;37(5):2289-99. doi: 10.1118/1.3395576. Med Phys. 2010. PMID: 20527563 Free PMC article.
-
Evaluating computer-aided detection algorithms.Med Phys. 2007 Jun;34(6):2024-38. doi: 10.1118/1.2736289. Med Phys. 2007. PMID: 17654906 Free PMC article.
References
-
- Thurfjell E, Taube A, Tabar L. One-view versus 2-view mammography screening—A prospective population-based study. Acta Radiol. 1994;35:340–344. - PubMed
-
- Warren R, Duffy S, Bashir S. The value of the second view in screening mammography. Br J Radiol. 1996;69:105–108. - PubMed
-
- Paquerault S, Petrick N, Chan HP, Sahiner B, Helvie MA. Improvement of computerized mass detection on mammograms: Fusion of two-view information. Med Phys. 2002;29:238–247. - PubMed
-
- Sahiner B, Gurcan MN, Chan HP, Hadjiiski LM, Petrick N, Helvie MA. The use of joint two-view information for computerized lesion detection on mammograms: Improvement of microcalcification detection accuracy. Med Phys. 2002;4684:754–761.
-
- Paquerault S, Petrick N, Chan HP, Sahiner B, Dolney AY. Improvement of mammographic lesion detection by fusion of information from different views. Proc SPIE. 2001;4322:1883–1889.
Publication types
MeSH terms
Grants and funding
LinkOut - more resources
Full Text Sources
Other Literature Sources
Medical
Miscellaneous

