. 2006 Aug 9:5:31.
doi: 10.1186/1476-4598-5-31.

Down-regulation of c-Myc following MEK/ERK inhibition halts the expression of malignant phenotype in rhabdomyosarcoma and in non muscle-derived human tumors

Affiliations

Down-regulation of c-Myc following MEK/ERK inhibition halts the expression of malignant phenotype in rhabdomyosarcoma and in non muscle-derived human tumors

Francesco Marampon et al. Mol Cancer. .

Abstract

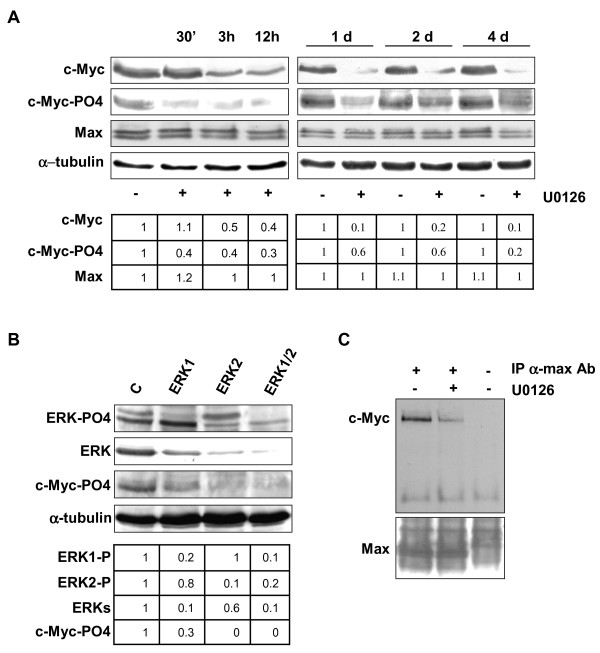
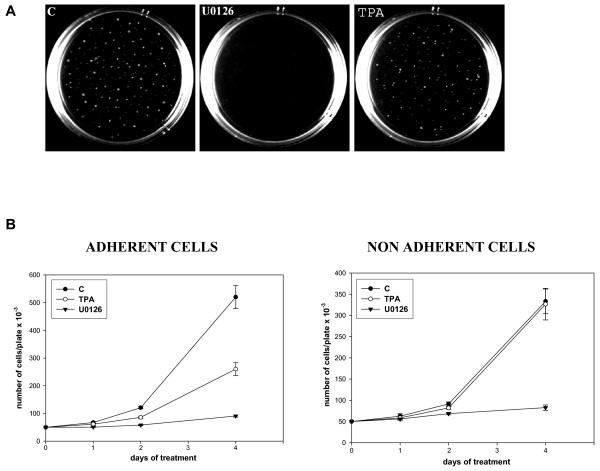
Background: Expression of c-myc proto-oncogene is inappropriate in a wide range of human tumors, and is a downstream target of Ras/Raf/ERK pathway, which promotes c-Myc stability by enhancing c-Myc expression and activity. The aim of this study was to investigate whether the oncogenic phenotype in the human muscle-derived Rhabdomyosarcoma (RD) cell line and in non muscle-derived human tumor cell lines (SW403, IGR39 and PC3) can be blocked by disrupting the c-Myc pathway either by means of pharmacological MEK/ERK inhibition or by direct inactivation of the c-Myc protein.

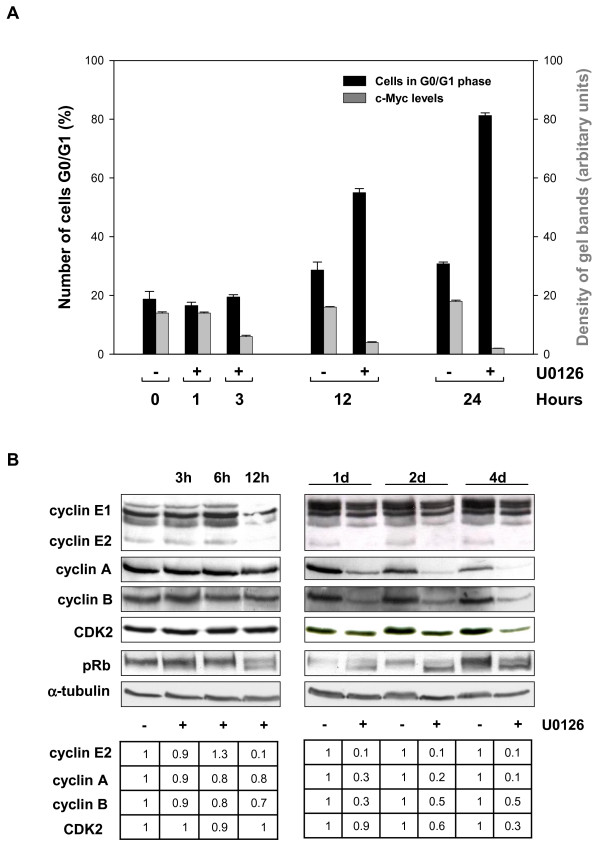
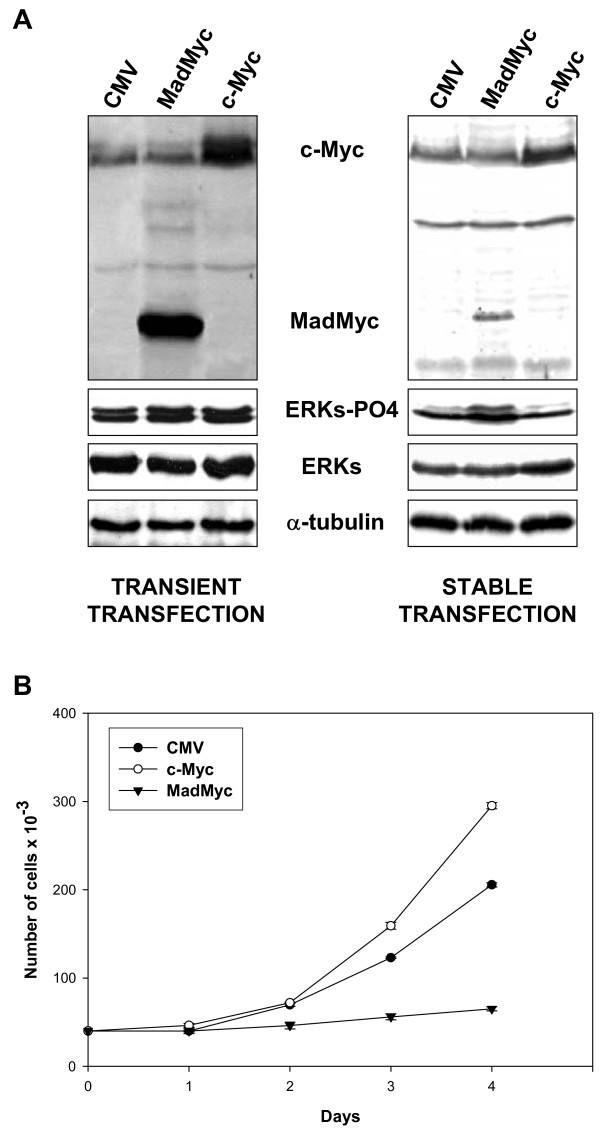
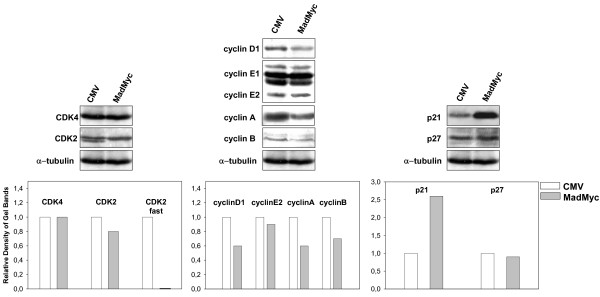
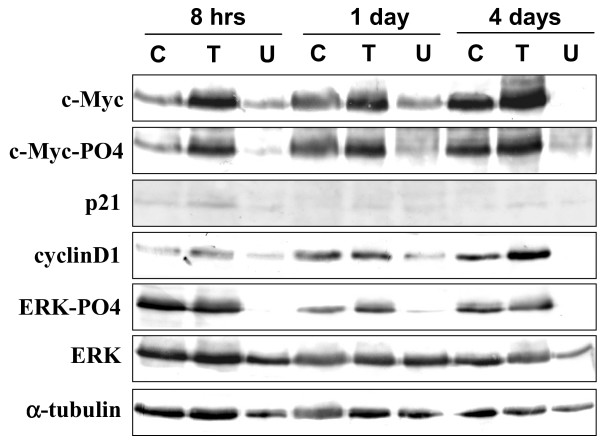
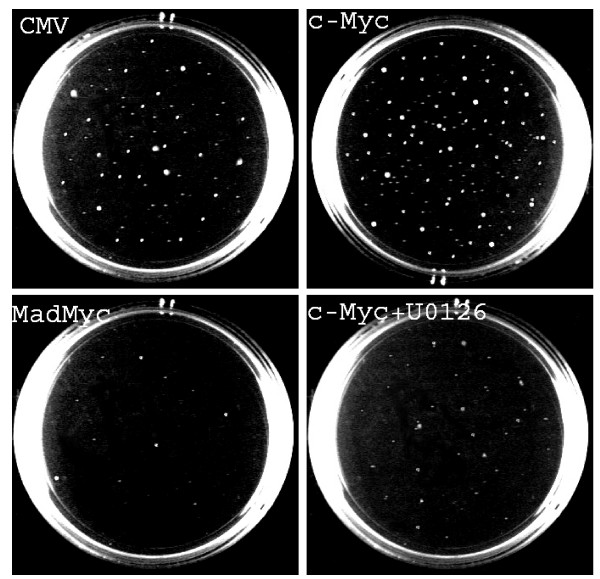
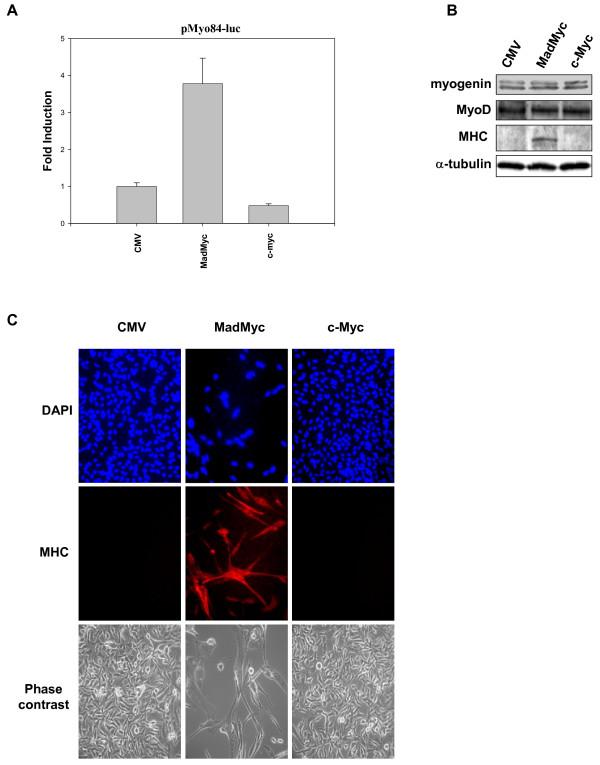
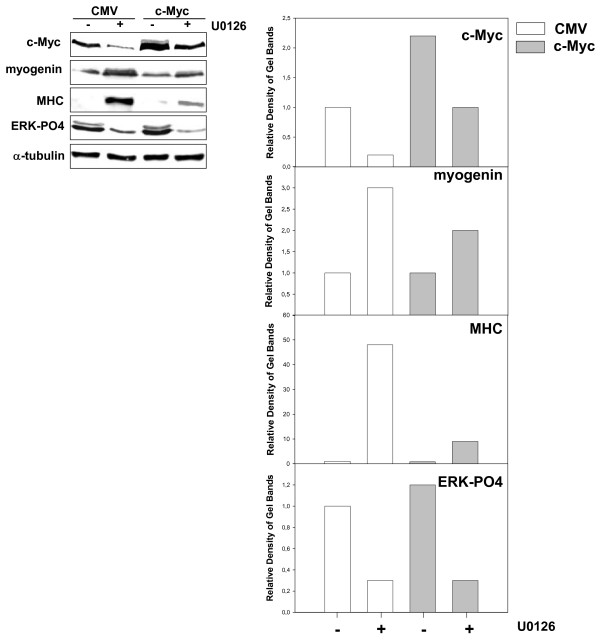
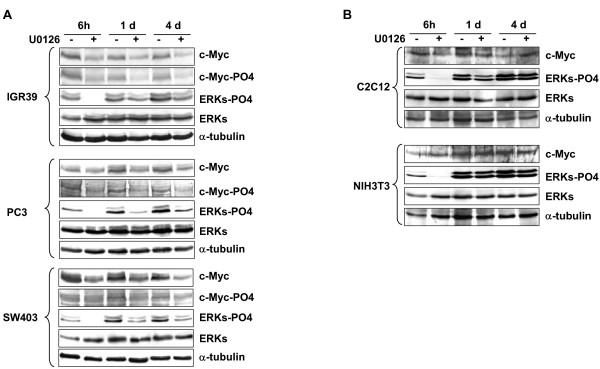
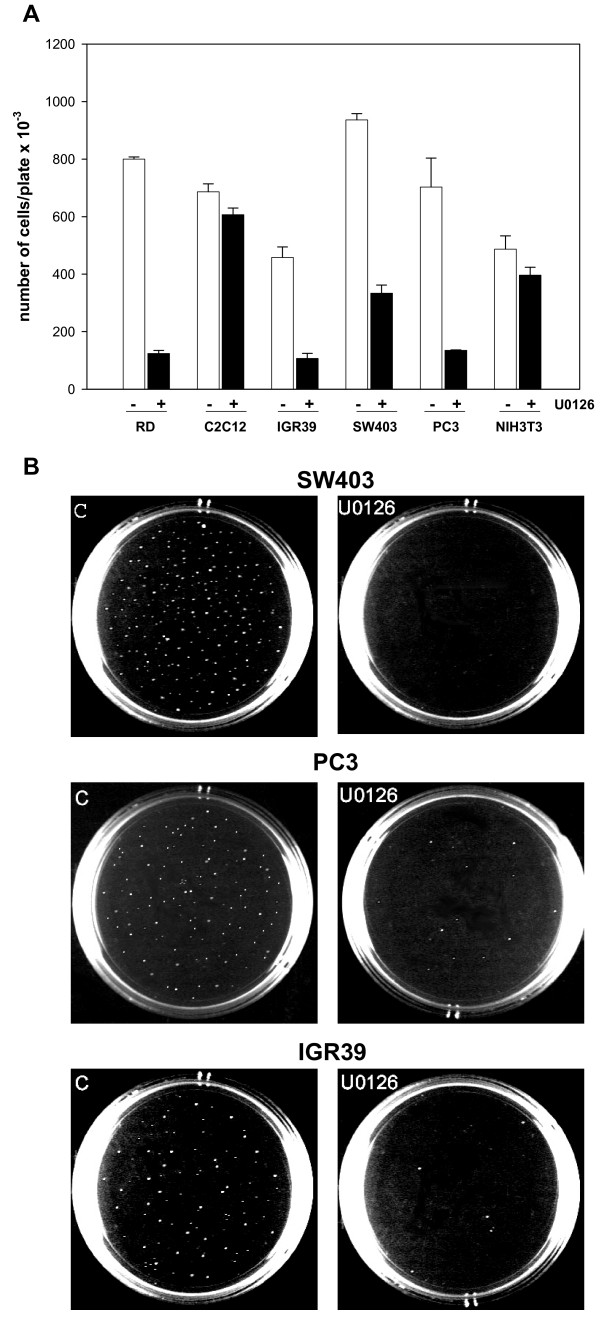
Results: We demonstrate that, in all the tumor cell lines used, the MEK/ERK inhibitor U0126 rapidly induces c-Myc de-phosphorylation, which is followed by a marked reduction in its expression level, by inhibition of proliferation and by reversion of anchorage-independent growth. These data suggest that the targeting of pathways controlling c-Myc expression or stability reverses deregulated growth of different tumor-derived cell lines. Indeed, in RD cells, we found a marked down-regulation of cyclins E2, A and B and CDK2, all of which are known to be targets of c-Myc. Moreover, ectopic MadMyc chimera, a c-Myc function antagonist, causes dramatic growth arrest, CDK and cyclin modulation as well as inhibition of anchorage-independent growth in RD cells, as occurs in U0126-treated cells. In particular, we found that the mere inhibition of c-Myc by MadMyc chimera rescues the myogenic program, MHC expression and the acquisition of the myogenic-like phenotype in RD cells.

Conclusion: Our data provide evidence of the key role played by the MEK/ERK pathway in the growth arrest and transformation phenotype of Rhabdomyosarcoma and of non muscle-derived tumor cell lines. In fact, MEK/ERK inhibitor, U0126, induces growth arrest, anchorage-dependent growth of these cell lines. In addition, the results of this study demonstrate that the direct inactivation of c-Myc by Mad/Myc chimera rescues myogenic program and leads to the reversal of the Rhabdomyosarcoma phenotype. In conclusion these data strongly suggest that the targeting of c-Myc by means of the MEK inhibitor can be tested as a promising strategy in anti-cancer therapy.


Figures

Figure 1
Figure 1
MEK/ERK inhibition affects c-Myc phosphorylation and expression in RD cells. A. Cell lysates from RD cells untreated (-) or treated (+) with 10 μM U0126 for indicated times were analysed by immunoblotting with specific antibodies for indicated proteins. α-tubulin expression shows the loading of samples. B. Cells were transfected with control (C) or ERK1, ERK2, ERK1/2 siRNAs and cultured for 3 days. Immunoblot of total lysates were performed using specific antibodies recognizing the indicated proteins. The values of fold increases over the control, arbitrarly set at 1, were obtained by densitometric analysis (A and B lower panels). C. Myc-Max heterodimer in RD cells untreated (-) or treated (+) with U0126 for 12 hours. Myc-Max complex was immunoprecipitated (IP) with a Max monoclonal antibody from extracts containing equal amounts of total proteins and subsequently analysed by immunoblotting with a c-Myc polyclonal antibody. Same filter was probed with a Max polyclonal antibody. Similar results were obtained in two different experiments.
Figure 2
Figure 2
c-Myc down-regulation precedes the U0126-mediated effects on G0/G1 arrest and cell cycle proteins expression. A. Histogram showing the number of RD cells in G0/G1 phase expressed as percentage (black bars) and c-Myc levels (grey bars) expressed as arbitrary units (density of c-Myc band/α-tubulin band) in untreated (-) and U0126-treated RD cells (+) for the indicated times. Similar results were obtained in two separate experiments B. Cell lysates from RD cells untreated (-) or treated (+) with U0126 for indicated times were analysed by immuoblotting with specific antibodies for indicated proteins. α-tubulin expression shows the loading of samples. The values of fold increases over the controls, arbitrarly set at 1, are obtained by densitometric analysis (lower panel). Similar results were obtained in three different experiments.
Figure 3
Figure 3
Cell cycle arrest by MadMyc chimera expression in RD cells. A. Cell lysates from polyclonal population of CMV, MadMyc chimera and c-Myc transiently and stably transfected RD cells were analysed by immunoblotting with c-Myc monoclonal antibody recognising both c-Myc and MadMyc chimera proteins. Same filters were re-probed with pospho-ERKs, ERKs and α-tubulin antibodies. B. Growth curve of polyclonal populations of RD cells stably transfected with MadMyc chimera (▼), c-Myc (○), and CMV (●). Polyclonal populations of stably transfected RD cells were plated and counted at indicated times. The data show the mean ± s.e.m. of triplicates of a representative experiment. Similar results were obtained in two experiments.
Figure 4
Figure 4
Effects of MadMyc chimera expression on CDK, cyclin and CKI proteins. Polyclonal populations of RD cells stably transfected with MadMyc chimera and CMV were plated and harvested after 4 days. Cell lysates were analysed by immunoblotting with specific antibodies for indicated proteins. α-tubulin expression shows equal loading. The histograms (lower panel) show the values of fold increase over the control, arbitrarly set at 1, obtained by densitometric analysis of the immunoblottings. Similar results were obtained in two experiments.
Figure 5
Figure 5
Effects of U0126 and TPA on anchorage independent growth of RD cells. A. RD cells left untreated (C) or treated with U0126 or 10-7 M TPA were tested for growth in soft agar. Colonies were photographed after 14 days. B. Growth curves of adherent and non adherent RD cells left untreated (●) or treated with U0126 (▼) or TPA (○). RD cells were counted at indicated times. The data shown are the mean ± s.e.m. of triplicates of a representative experiment. Similar results were obtained in three experiments for A and two for B.
Figure 6
Figure 6
Effects of U0126 and TPA on the expression of c-Myc, p21WAF1, cyclin D1 and ERKs of RD cells grown in suspension culture. Cell lysates from cells left untreated (C) or treated with U0126 (U) or TPA (T) for indicated times were analysed by immuoblotting with specific antibodies for indicated proteins. α-tubulin expression shows the loading of samples. Similar results were obtained in two different experiments.
Figure 7
Figure 7
Effects of c-myc on anchorage independent growth of RD cells. Polyclonal populations of RD cells stably transfected with MadMyc chimera, c-Myc and CMV vectors were tested for growth in soft agar. c-Myc polyclonal populations were left untreated or treated with U0126. Colonies were photographed after 14 days. Similar results were obtained in two experiments.
Figure 8
Figure 8
Activation of myogenic program in MadMyc chimera transiently transfected RD cells. A. Luciferase assay of lysate from RD cells co-transfected with the empty vector (CMV) or MadMyc- or c-Myc-expressing vectors and the plasmid carrying myogenin promoter (pMyo84-luc). The histogram shows the fold induction of myogenin promoter (pMyo84-luc) of MadMyc- or c-Myc- versus CMV-transfected RD cells arbitrarily set at 1. Data show mean values ± s.e.m. of triplicates of two experiments. B. Immunoblotting of parallel culture as in (A) with antibodies for indicated proteins. C. Immunofluorescence with antibody directed to sarcomeric myosin (MHC) of RD cells stably transfected with MadMyc chimera, c-Myc and CMV after 4 days of plating (middle panels). Cell nuclei were stained with DAPI (upper panels). Photomicrographs by contrast phase (lower panels) of other fields. Similar results were obtained in two experiments.
Figure 9
Figure 9
c-Myc overexpression attenuates U0126 differentiative effects. Immunoblotting with specific antibodies for indicated proteins of cell lysates from c-Myc polyclonal population of RD cells left untreated or treated with U0126. α-tubulin expression shows the loading of samples. The histograms (right panel) show the values of fold increases over the control, arbitrarly set at 1, obtained by densitometric analysis of the immunoblottings. Similar results were obtained in two experiments.
Figure 10
Figure 10
Down-regulation of c-Myc by U0126 in non-muscle tumor cell lines. A. Total lysates from the indicated non-muscle tumor cell lines untreated (-) or treated (+) with 10 μM U0126 for indicated times were analysed by immunoblotting with anti-c-Myc, anti-pospho-c-Myc, anti-ERKs and anti pospho-ERKs. B. Total lysates from untransformed C2C12 and NIH3T3 were analysed by immunoblotting with anti-c-Myc, anti-ERKs and anti pospho-ERKs. α-tubulin expression shows the loading of samples. Similar results were obtained in two experiments.
Figure 11
Figure 11
Effects of U0126 on non-muscle tumor cell lines proliferation and anchorage-independent growth. A. The histogram shows the number of cells from tumor cell lines and, as control, from untransformed C2C12 and NIH3T3, cultured for 4 days with (+) or without (-) U0126. The data shown are the mean ± s.e.m. of triplicates of a representative experiment. B. Tumor cells left untreated (C) or treated with U0126 were tested for growth in soft agar. Colonies were photographed after 14 days. Similar results were obtained in two experiments.

Similar articles

Cited by

References

    1. Grandori C, Cowley SM, James LP, Eisenman RN. The Myc/Max/Mad network and the transcriptional control of cell behavior. Annu Rev Cell Dev Biol. 2000;16:653–699. doi: 10.1146/annurev.cellbio.16.1.653. - DOI - PubMed
    1. Henriksson M, Luscher B. Proteins of the Myc network: essential regulators of cell growth and differentiation. Adv Cancer Res. 1996;68:109–182. - PubMed
    1. Oster SK, Ho CS, Soucie EL, Penn LZ. The myc oncogene: MarvelouslY Complex. Adv Cancer Res. 2002;84:81–154. - PubMed
    1. Watson JD, Oster SK, Shago M, Khosravi F, Penn LZ. Identifying genes regulated in a Myc-dependent manner. J Biol Chem. 2002;277:36921–36930. doi: 10.1074/jbc.M201493200. - DOI - PubMed
    1. Menssen A, Hermeking H. Characterization of the c-MYC-regulated transcriptome by SAGE: identification and analysis of c-MYC target genes. Proc Natl Acad Sci USA. 2002;99:6274–6279. doi: 10.1073/pnas.082005599. - DOI - PMC - PubMed

Publication types

MeSH terms