Induction of single chain tetracycline repressor requires the binding of two inducers
- PMID: 16899452
- PMCID: PMC1557800
- DOI: 10.1093/nar/gkl316
Induction of single chain tetracycline repressor requires the binding of two inducers
Abstract
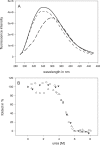
In this article we report the in vivo and in vitro characterization of single chain tetracycline repressor (scTetR) variants in Escherichia coli. ScTetR is genetically and proteolytically stable and exhibits the same regulatory properties as dimeric TetR in E.coli. Urea-dependent denaturation of scTetR is independent of the protein concentration and follows the two-state model with a monophasic transition. Contrary to dimeric TetR, scTetR allows the construction of scTetR mutants, in which one subunit contains a defective inducer binding site while the other is functional. We have used this approach to establish that scTetR needs occupation of both inducer binding sites for in vivo and in vitro induction. Single mutations causing loss of induction in dimeric TetR lead to non-inducible scTetR when inserted into one half-side. The construction of scTetR H64K S135L S138I (scTetR(i2)) in which one half-side is specific for 4-dedimethylamino-anhydrotetracycline (4-ddma-atc) and the other for tetracycline (tc) leads to a protein which is only inducible by the mixture of tc and 4-ddma-atc. Fluorescence titration of scTetR(i2) with both inducers revealed distinct occupancy with each of these inducers yielding roughly a 1:1 stoichiometry of each inducer per scTetR(i2). The properties of this gain of function mutant clearly demonstrate that scTetR requires the binding of two inducers for induction of transcription.
Figures


Similar articles
-
Structure-based design of Tet repressor to optimize a new inducer specificity.Biochemistry. 2004 Jul 27;43(29):9512-8. doi: 10.1021/bi049682j. Biochemistry. 2004. PMID: 15260494
-
Teaching TetR to recognize a new inducer.J Mol Biol. 2003 May 30;329(2):217-27. doi: 10.1016/s0022-2836(03)00427-3. J Mol Biol. 2003. PMID: 12758071
-
Two mutations in the tetracycline repressor change the inducer anhydrotetracycline to a corepressor.Nucleic Acids Res. 2004 Feb 4;32(2):842-7. doi: 10.1093/nar/gkh200. Print 2004. Nucleic Acids Res. 2004. PMID: 14764926 Free PMC article.
-
Gene regulation by tetracyclines. Constraints of resistance regulation in bacteria shape TetR for application in eukaryotes.Eur J Biochem. 2003 Aug;270(15):3109-21. doi: 10.1046/j.1432-1033.2003.03694.x. Eur J Biochem. 2003. PMID: 12869186 Review.
-
Mechanisms underlying expression of Tn10 encoded tetracycline resistance.Annu Rev Microbiol. 1994;48:345-69. doi: 10.1146/annurev.mi.48.100194.002021. Annu Rev Microbiol. 1994. PMID: 7826010 Review.
Cited by
-
The application of Tet repressor in prokaryotic gene regulation and expression.Microb Biotechnol. 2008 Jan;1(1):2-16. doi: 10.1111/j.1751-7915.2007.00001.x. Microb Biotechnol. 2008. PMID: 21261817 Free PMC article. Review.
-
Status quo of tet regulation in bacteria.Microb Biotechnol. 2022 Apr;15(4):1101-1119. doi: 10.1111/1751-7915.13926. Epub 2021 Oct 29. Microb Biotechnol. 2022. PMID: 34713957 Free PMC article. Review.
-
Two functional S100A4 monomers are necessary for regulating nonmuscle myosin-IIA and HCT116 cell invasion.Biochemistry. 2011 Aug 16;50(32):6920-32. doi: 10.1021/bi200498q. Epub 2011 Jul 13. Biochemistry. 2011. PMID: 21721535 Free PMC article.
-
New architectures for Tet-on and Tet-off regulation in Staphylococcus aureus.Appl Environ Microbiol. 2010 Feb;76(3):680-7. doi: 10.1128/AEM.02416-09. Epub 2009 Dec 4. Appl Environ Microbiol. 2010. PMID: 19966017 Free PMC article.
-
Tetracycline-tet repressor binding specificity: insights from experiments and simulations.Biophys J. 2009 Nov 18;97(10):2829-38. doi: 10.1016/j.bpj.2009.08.050. Biophys J. 2009. PMID: 19917238 Free PMC article.
References
-
- Browning D.F., Busby S.J. The regulation of bacterial transcription initiation. Nature Rev. Microbiol. 2004;2:57–65. - PubMed
-
- Huffman J.L., Brennan R.G. Prokaryotic transcription regulators: more than just the helix-turn-helix motif. Curr. Opin. Struct. Biol. 2002;12:98–106. - PubMed
-
- Busby S., Ebright R.H. Transcription activation by catabolite activator protein (CAP) J Mol. Biol. 1999;293:199–213. - PubMed
-
- Henssler E.M., Bertram R., Wisshak S., Hillen W. Tet repressor mutants with altered effector binding and allostery. FEBS J. 2005;272:4487–4496. - PubMed
Publication types
MeSH terms
Substances
LinkOut - more resources
Full Text Sources
Other Literature Sources
Research Materials

